MonitorMojo Blog
Developer Website Monitoring Playbook
A developer website monitoring playbook provides a complete guide to setting up monitoring, integrating with CI/CD, automating checks, and maintaining site reliability. This guide provides a comprehensive developer website monitoring playbook, with step-by-step instructions and best practices. This expanded guide explains the practical monitoring workflow behind the topic, who should use it, what to check, how to document findings, and how to turn website health signals into useful client, developer, API, CLI, or AI-agent workflows without overstating what monitoring can prove.
Why Use a Developer Monitoring Playbook
A developer website monitoring playbook provides a complete guide to setting up monitoring, integrating with CI/CD, automating checks, and maintaining site reliability. Instead of figuring out monitoring from scratch, you can follow a proven playbook.
Playbooks ensure consistency. Every developer follows the same process, reducing the risk of missed checks or inconsistent monitoring. Playbooks also provide documentation that can be reviewed and improved over time.
This guide provides a comprehensive developer website monitoring playbook, with step-by-step instructions and best practices.
Setting Up Monitoring
Start by setting up monitoring for your website. Choose a monitoring tool that provides comprehensive health checks, API access, and integration capabilities. MonitorMojo is designed for developers and provides all of these features.
Configure monitoring for all critical metrics: uptime, SSL certificate status, response time, security headers, and any other metrics that matter for your site.
Set up alerting. When issues are detected, alerts should go to the right people through the right channels. Use Slack, email, SMS, or webhooks to notify the team.
Test the monitoring setup. Run checks, verify that alerts are sent, and ensure that the monitoring system is working correctly.
Integrating with CI/CD
Integrate monitoring into your CI/CD pipeline. Run health checks before deployment to ensure the site is healthy, and after deployment to validate that the deployment did not break anything.
If checks fail, fail the pipeline. This prevents broken deployments from reaching production. The pipeline should provide clear error messages so the team can quickly identify and fix the issue.
Use the monitoring API or CLI to run checks in CI/CD. The API returns structured JSON data that is easy to parse and analyze. The CLI provides a simple interface for running checks and retrieving results.
Document the CI/CD integration. Ensure that every developer understands how monitoring is integrated into the deployment process.
Automating Checks
Automate health checks to run on schedule. Use cron jobs, scheduled tasks, or cloud functions to run checks hourly, daily, or weekly.
Automate alerting. When issues are detected, alerts should be sent automatically. Do not rely on manual monitoring.
Automate reporting. Generate reports on site health, trends, and issues. Share reports with the team to keep everyone informed.
Automate response. When issues are detected, automated workflows can trigger actions: restart services, roll back deployments, or notify the team.
Maintaining Site Reliability
Use monitoring data to maintain site reliability. Analyze trends, identify patterns, and make data-driven decisions about infrastructure and deployments.
Review monitoring data regularly. Look for issues, trends, and opportunities for improvement. Use the data to inform decisions about infrastructure, deployments, and site reliability.
Document everything. Document the monitoring setup, the CI/CD integration, the automation workflows, and the response processes. Documentation ensures that everyone understands the process and can follow it consistently.
Continuously improve. Review the playbook regularly and update it as your site evolves. Add new checks for new features, remove checks for deprecated features, and adjust thresholds as needed.
How MonitorMojo Helps with Developer Playbooks
MonitorMojo provides an API and CLI that make it easy to integrate monitoring into developer workflows. The API returns structured JSON data that is easy to parse and analyze.
MonitorMojo is designed for developers. It provides clear endpoints, structured responses, and comprehensive documentation. The API is easy to integrate into CI/CD pipelines, automation workflows, and custom applications.
MonitorMojo also provides historical data, so you can analyze trends over time and provide more intelligent insights.
The credit-based pricing means you only pay for the checks you run. No per-site monthly fees. This makes it easy to scale your monitoring without breaking the budget.
What this workflow means
Developer Website Monitoring Playbook is best understood as a repeatable website health workflow, not a promise that every outage or configuration issue will be avoided. Get a comprehensive developer website monitoring playbook. Learn how to set up monitoring, integrate with CI/CD, automate checks, and maintain site reliability.
In practice, this workflow centers on uptime, SSL certificates, response time, security headers, website health summaries, and monthly review notes. Each check is planning input: it can show that the production site is reachable, that a certificate has a given expiry window, that response time has shifted, or that a header is missing. It cannot prove root cause by itself or replace a human response. The value is in making the review consistent enough that developers and DevOps teams can spot issues before someone downstream has to ask about them.
Who should use this
This is most useful for developers and DevOps teams. Developers building monitoring playbooks
Beyond that primary audience, the same checks are reusable by anyone with a public-facing URL that matters to revenue, leads, or reputation: a recurring review is cheap insurance compared to hearing about the problem from a client or customer first.
Step-by-step monitoring workflow
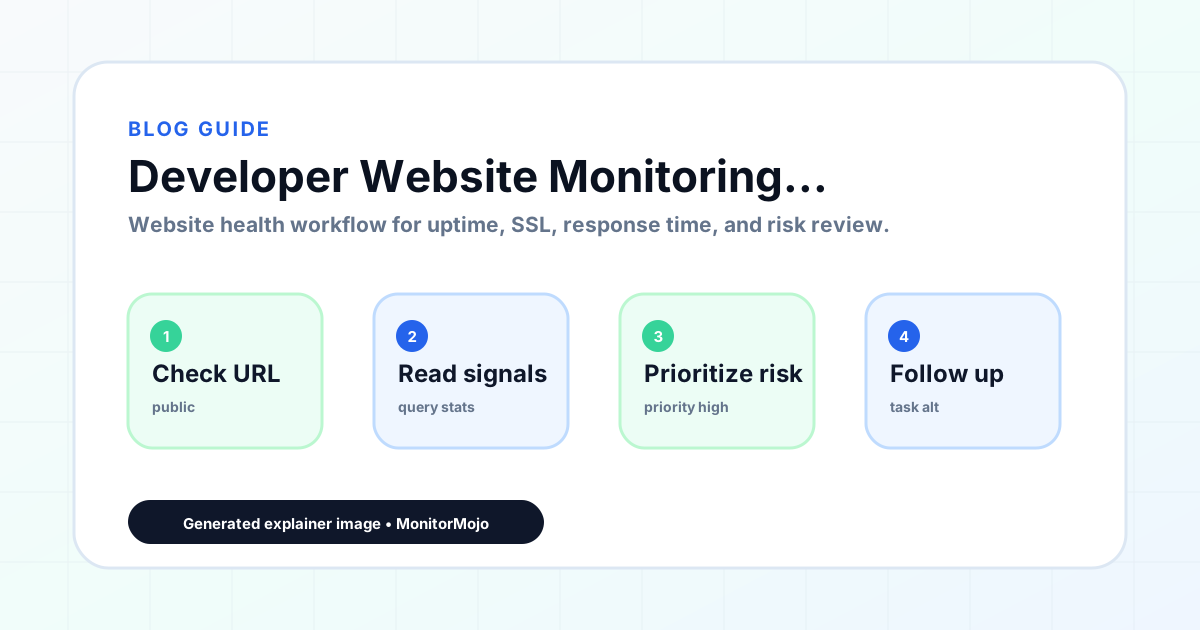
Start by listing the URLs that actually matter instead of just the homepage — for a developer confirming production is healthy right after a deployment, that usually means the pages tied to revenue, signups, or trust, not every page on the site.
Next, define the check types for each URL: reachability, HTTP status, HTTPS/SSL certificate status and expiry window, response time, redirect behavior, and security header presence. For API, CLI, and AI-agent workflows, document which endpoint or command runs the check and where the result is stored.
Set a cadence that matches the risk — a low-traffic page may only need a monthly look, while a page tied to revenue or signups deserves a check after every deployment and before any campaign or launch.
Record what you find with a consistent format: URL, check type, status, issue, owner, detected date, and next review date. Then say what actually happened in plain language — a check can surface a symptom, but developers and DevOps teams still need to confirm the cause.
- Choose the URLs that matter most to visitors, clients, revenue, and operations.
- Run uptime, SSL, response time, and security header checks on a consistent schedule.
- Triage failed or risky checks by likely owner: hosting, DNS, SSL, code, platform, or third party.
- Record notes in a repeatable format so future reviews do not start from scratch.
- Send a plain-language summary with the issue, impact, owner, and next review date.
- Run a confirmation check after remediation so there is an external result to reference.
Checklist or template
Use this template for recurring reviews: [URL], [Check Type], [Status], [Issue], [Priority], [Owner], [Detected Date], [Resolved Date], [Next Review Date]. Add a one-line summary at the top: what changed, what needs attention, and who owns the next step.
For developers and DevOps teams, group findings into the four signals that matter most: reachability, SSL status, response time, and security headers. Where nothing needs action, say the check found no issue in that area rather than implying full coverage.
- [URL]: the exact page or endpoint checked.
- [Check Type]: uptime, SSL, response time, headers, API, CLI, or agent workflow.
- [Status]: pass, review, failed, blocked, or needs human investigation.
- [Issue]: the observable symptom, not an unsupported root-cause claim.
- [Owner]: agency, developer, host, DNS provider, client, or third-party vendor.
- [Next Review Date]: when the team should confirm status again.
Common mistakes
The most common mistake is monitoring only the homepage while a checkout, signup, or booking flow silently breaks. Another is assuming SSL auto-renewal always works — it can fail quietly, and an external check is the only way to catch that before a browser warning does.
For developers and DevOps teams specifically, the recurring miss is treating one clean check as proof the whole site is fine, or fixing an issue without ever writing down what happened — which means the next person repeats the same investigation from zero.
- Tracking too many low-value URLs while missing the ones that matter.
- Skipping notes after an issue is resolved.
- Reporting a status without an owner or next step attached.
- Assuming automation can resolve an incident without human review.
- Treating one clean check as proof that every risk is covered.
Practical example
Consider a developer confirming production is healthy right after a deployment. A scheduled check flags that the production site is slower than its usual baseline and that a security header is missing. Instead of guessing, the team logs the observation with a timestamp, assigns an owner, and re-checks after the fix ships — turning a vague "something feels off" into a specific, closed-loop task.
How MonitorMojo helps
MonitorMojo runs website health checks that combine reachability, SSL certificate status, response time, and security header presence in one workspace, so this workflow doesn't require stitching together several separate tools.
The API and CLI make the same checks scriptable for developers and DevOps teams who want them wired into an existing process, while credit-based checks keep it practical to run reviews exactly when they matter — before a client call, after a deploy, or when someone asks whether the production site is healthy. Results still depend on hosting, DNS, and how quickly the responsible team acts on what the check finds.
Who this is for
- Developers building monitoring playbooks
- Teams setting up website monitoring
- Anyone integrating monitoring into CI/CD
- Developers maintaining site reliability
Frequently Asked Questions
Why should I use a developer monitoring playbook?
A developer monitoring playbook provides a complete guide to setting up monitoring, integrating with CI/CD, automating checks, and maintaining site reliability. Playbooks ensure consistency and provide documentation that can be reviewed and improved over time.
How do I set up monitoring?
Choose a monitoring tool that provides comprehensive health checks, API access, and integration capabilities. Configure monitoring for all critical metrics, set up alerting, and test the monitoring setup.
How do I integrate monitoring with CI/CD?
Run health checks before and after deployment. If checks fail, fail the pipeline. Use the monitoring API or CLI to run checks in CI/CD.
How do I automate checks?
Use cron jobs, scheduled tasks, or cloud functions to run checks on schedule. Automate alerting, reporting, and response workflows.
How does MonitorMojo help with developer playbooks?
MonitorMojo provides an API and CLI with clear endpoints, structured responses, and comprehensive documentation. Credit-based pricing makes it easy to scale.
Can this prevent every issue with the production site?
No. Monitoring helps developers and DevOps teams detect website health signals and organize follow-up, but it does not prevent every outage, SSL issue, slow response, or third-party failure. The result still depends on hosting, DNS, infrastructure, and how quickly the responsible team investigates and responds.