MonitorMojo Blog
Website Checker API: How Teams Can Automate Site Checks
A website checker API lets teams integrate website health checks directly into their existing workflows rather than relying on manual dashboard visits or a separate monitoring interface. For agencies building client onboarding automation, developers incorporating pre-deployment health checks into CI pipelines, or teams that want to trigger checks based on events in other tools, an API gives you programmatic control over when and how website checks run. This expanded guide explains the practical monitoring workflow behind the topic, who should use it, what to check, how to document findings, and how to turn website health signals into useful client, developer, API, CLI, or AI-agent workflows without overstating what monitoring can prove.
What a website checker API does
A website checker API accepts a URL as input and returns structured health check data: reachability status, HTTP status code, SSL certificate validity and expiry window, server response time, security header presence, and domain risk signals. The same check you run manually in a dashboard is now available as a data endpoint that any tool with HTTP capabilities can call.
The API returns data in a machine-readable format — typically JSON — that can be parsed, stored, compared, or displayed in any interface or system. Instead of reading a health check result visually in a browser, your code reads it programmatically and can take action based on what it finds.
This opens up workflows that are not practical through a manual interface: checking hundreds of URLs in sequence, running checks automatically when a deployment completes, comparing current health to a stored baseline, or sending formatted alerts through your existing notification channels.
Agency use cases for a website checker API
For agencies building client management tools, a website checker API lets you embed health check data directly into your CRM, project management tool, or client reporting system. Instead of manually running a check and copying results, your tool calls the API, stores the result, and surfaces it in the client record automatically.
Client onboarding workflows are a natural fit. When a new client is added to your system, an API call can trigger an initial health check on their domain and populate their client record with the baseline data — SSL expiry, response time, security headers. This happens automatically as part of onboarding rather than as a manual step that gets skipped.
Monthly reporting automation is another strong use case. A script that runs at the beginning of each month, calls the API for every client domain, and populates a report template with the current health data eliminates the manual data-gathering step and ensures reports are based on fresh check results rather than data from the previous week.
Developer use cases in CI/CD pipelines
Development teams can incorporate website checks into deployment pipelines as a post-deploy verification step. After a build deploys to staging or production, an automated health check confirms that the deployment was successful from a visitor's perspective — the site is reachable, HTTPS is working, and response time is within normal range.
This is particularly valuable for hosting migrations and infrastructure changes. A deployment that moves a site from one server to another can silently break SSL configuration, redirect behavior, or security headers. An automated post-deploy check catches these issues immediately rather than waiting for a manual review or a client complaint.
Checks can also be used as deployment gates. If a pre-production health check returns an SSL warning or an unexpected status code, the deployment can be flagged for review before it goes live. This adds a health verification layer to the deployment process without requiring anyone to manually visit the site.
Integrating health checks into existing tools
Most agencies and development teams have existing tools they use daily — Slack, Notion, Airtable, Zapier, GitHub Actions, or custom internal dashboards. A website checker API integrates with all of these through standard HTTP calls, making it possible to surface health check data in the tools where teams already work.
A simple Slack integration can post a health summary to a channel after a deployment completes. A Zapier workflow can trigger a check whenever a new client is added to a CRM and create a task if the check reveals an issue. A GitHub Action can run a health check as part of a deployment workflow and fail the action if the check returns a critical finding.
The MonitorMojo API is designed for these kinds of integrations. Review the API documentation at /api-docs for endpoints, request formats, and response schemas. The credit-based model means API calls consume credits from your account — predictable and transparent cost control for automated workflows.
What to do with API check results
Raw API data is most useful when combined with logic that interprets the results and routes them to the right place. A check that returns an SSL certificate with 8 days remaining needs different handling than one that returns a certificate with 90 days remaining. Building that logic into your integration means the right people get notified through the right channels at the right urgency level.
Consider what actions each finding should trigger. An SSL certificate under 14 days should send an urgent notification to whoever manages SSL for that client. A response time spike of 3x the baseline should create a review task. A 500 error on a critical page should trigger an immediate alert. These decision rules live in your integration code, not in the monitoring tool itself.
Store check results over time. A history of check results for each domain gives you the trend data that makes individual readings meaningful. A single 800ms response time is ambiguous. Eight consecutive monthly readings that show a clear upward trend from 300ms to 800ms is a pattern that warrants a conversation with the client about hosting.
Getting started with the MonitorMojo API
The MonitorMojo API documentation at /api-docs covers the full reference for endpoints, authentication, request parameters, and response formats. Authentication uses API keys — generated from your dashboard — which should be stored securely in environment variables rather than hard-coded in application code.
For agencies building their first integration, a simple script that loops through a list of client domains, calls the check endpoint for each, and writes the results to a spreadsheet or database is a practical starting point. This replicates the manual monthly check workflow but removes the manual steps.
Rate limits and credit consumption apply to API calls the same as manual checks. Plan your integration's check volume against your credit balance, and build in error handling for rate limit responses so that high-volume workflows degrade gracefully rather than failing loudly.
What this workflow means
Website Checker API: How Teams Can Automate Site Checks is best understood as a repeatable website health workflow, not a promise that every outage or configuration issue will be avoided. Learn how a website checker API works, what use cases it enables for agencies and developers, and how to integrate automated website checks into your existing workflows.
In practice, this workflow centers on API, CLI, and AI-agent workflows that retrieve website health context with human review. Each check is planning input: it can show that a monitored endpoint is reachable, that a certificate has a given expiry window, that response time has shifted, or that a header is missing. It cannot prove root cause by itself or replace a human response. The value is in making the review consistent enough that AI-agent builders and automation teams can spot issues before someone downstream has to ask about them.
Who should use this
This is most useful for AI-agent builders and automation teams. The common thread is an AI agent retrieving website health context before a human reviews it, where a missed signal costs more than the few minutes it takes to check.
Beyond that primary audience, the same checks are reusable by anyone with a public-facing URL that matters to revenue, leads, or reputation: a recurring review is cheap insurance compared to hearing about the problem from a client or customer first.
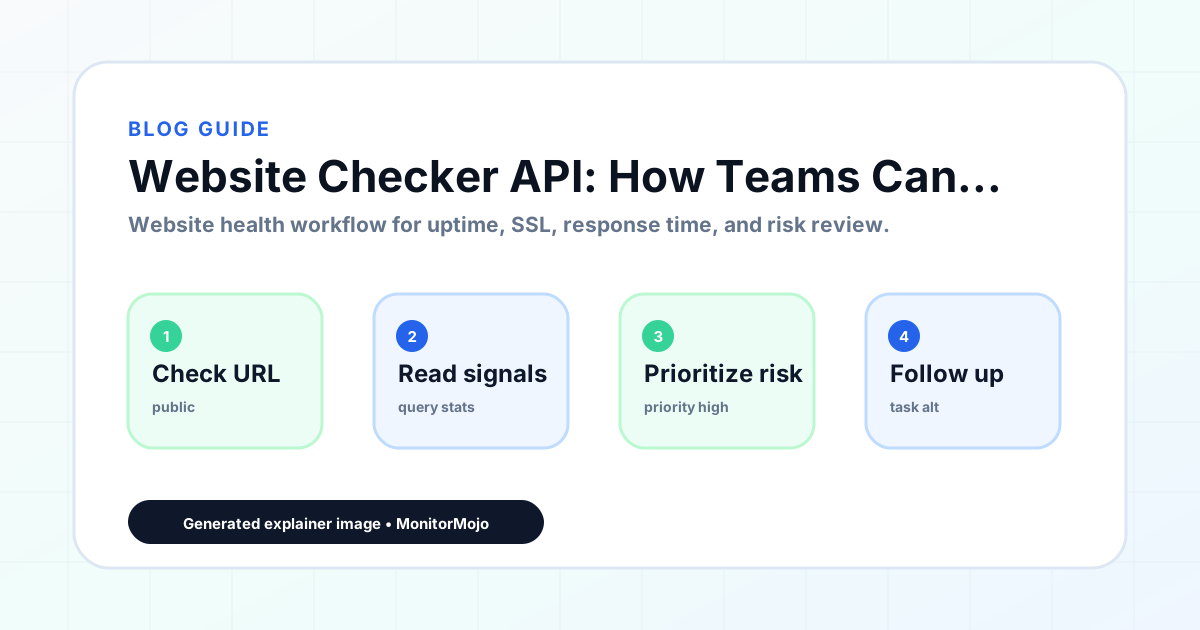
Step-by-step monitoring workflow
Start by listing the URLs that actually matter instead of just the homepage — for an AI agent retrieving website health context before a human reviews it, that usually means the pages tied to revenue, signups, or trust, not every page on the site.
Next, define the check types for each URL: reachability, HTTP status, HTTPS/SSL certificate status and expiry window, response time, redirect behavior, and security header presence. For API, CLI, and AI-agent workflows, document which endpoint or command runs the check and where the result is stored.
Set a cadence that matches the risk — a low-traffic page may only need a monthly look, while a page tied to revenue or signups deserves a check after every deployment and before any campaign or launch.
Record what you find with a consistent format: URL, check type, status, issue, owner, detected date, and next review date. Then say what actually happened in plain language — a check can surface a symptom, but AI-agent builders and automation teams still need to confirm the cause.
- Choose the URLs that matter most to visitors, clients, revenue, and operations.
- Run uptime, SSL, response time, and security header checks on a consistent schedule.
- Triage failed or risky checks by likely owner: hosting, DNS, SSL, code, platform, or third party.
- Record notes in a repeatable format so future reviews do not start from scratch.
- Send a plain-language summary with the issue, impact, owner, and next review date.
- Run a confirmation check after remediation so there is an external result to reference.
Checklist or template
Use this template for recurring reviews: [URL], [Check Type], [Status], [Issue], [Priority], [Owner], [Detected Date], [Resolved Date], [Next Review Date]. Add a one-line summary at the top: what changed, what needs attention, and who owns the next step.
For AI-agent builders and automation teams, group findings into the four signals that matter most: reachability, SSL status, response time, and security headers. Where nothing needs action, say the check found no issue in that area rather than implying full coverage.
- [URL]: the exact page or endpoint checked.
- [Check Type]: uptime, SSL, response time, headers, API, CLI, or agent workflow.
- [Status]: pass, review, failed, blocked, or needs human investigation.
- [Issue]: the observable symptom, not an unsupported root-cause claim.
- [Owner]: agency, developer, host, DNS provider, client, or third-party vendor.
- [Next Review Date]: when the team should confirm status again.
Common mistakes
The most common mistake is monitoring only the homepage while a checkout, signup, or booking flow silently breaks. Another is assuming SSL auto-renewal always works — it can fail quietly, and an external check is the only way to catch that before a browser warning does.
For AI-agent builders and automation teams specifically, the recurring miss is treating one clean check as proof the whole site is fine, or fixing an issue without ever writing down what happened — which means the next person repeats the same investigation from zero.
- Tracking too many low-value URLs while missing the ones that matter.
- Skipping notes after an issue is resolved.
- Reporting a status without an owner or next step attached.
- Assuming automation can resolve an incident without human review.
- Treating one clean check as proof that every risk is covered.
Practical example
Consider an AI agent retrieving website health context before a human reviews it. A scheduled check flags that a monitored endpoint is slower than its usual baseline and that a security header is missing. Instead of guessing, the team logs the observation with a timestamp, assigns an owner, and re-checks after the fix ships — turning a vague "something feels off" into a specific, closed-loop task.
How MonitorMojo helps
MonitorMojo runs website health checks that combine reachability, SSL certificate status, response time, and security header presence in one workspace, so this workflow doesn't require stitching together several separate tools.
The API and CLI make the same checks scriptable for AI-agent builders and automation teams who want them wired into an existing process, while credit-based checks keep it practical to run reviews exactly when they matter — before a client call, after a deploy, or when someone asks whether a monitored endpoint is healthy. Results still depend on hosting, DNS, and how quickly the responsible team acts on what the check finds.
Frequently Asked Questions
What does the MonitorMojo API return for a website check?
The API returns structured JSON data covering reachability status, HTTP status code, SSL certificate validity and expiry, server response time, security header presence, and domain risk signals — the same data visible in a manual check, in a machine-readable format.
Can I use the API in a CI/CD deployment pipeline?
Yes. A common pattern is a post-deploy step that calls the API on the deployed URL and validates the response before the deployment is marked successful. This catches hosting configuration issues, SSL problems, and unexpected status codes immediately after a deploy rather than waiting for manual review.
How does API pricing work?
API calls consume credits from your MonitorMojo account the same as manual checks. Credit packs are purchased once and used as needed — there is no separate API subscription. This makes the cost predictable for automated workflows where you can estimate check volume in advance.
Do I need a developer to use the MonitorMojo API?
Basic API use — making HTTP requests and parsing JSON — requires some technical familiarity. No-code tools like Zapier can also call the MonitorMojo API without writing code directly. The API documentation at /api-docs includes examples to help you get started.
What is the difference between using the API and using the dashboard?
The dashboard is designed for manual, human-readable workflows. The API is designed for programmatic, automated workflows. Both access the same check functionality and consume credits the same way. Use the dashboard when you want to run checks manually and review results visually; use the API when you want to automate check execution or integrate results into other tools.
Can this prevent every issue with a monitored endpoint?
No. Monitoring helps AI-agent builders and automation teams detect website health signals and organize follow-up, but it does not prevent every outage, SSL issue, slow response, or third-party failure. The result still depends on hosting, DNS, infrastructure, and how quickly the responsible team investigates and responds.