Downtime costs money
Every minute a website is down can mean lost sales, lost leads, and lost trust. Faster detection means faster recovery.
Loading...
Downtime Alerts
Website downtime alerts help teams respond faster when sites go offline. MonitorMojo checks uptime, SSL status, response time, and security headers on demand and saves every result to your check history. Run checks on a schedule with the CLI or API and connect the output to your own Slack, email, or webhook alerts to know the moment something changes. In-app automated alerting is currently a preview built on sample data, not a live feature yet.
No credit card required · Real checks only · Sample monitoring workflow shown
Website health signals, not live monitoring data
The Problem
Every minute a website is down can mean lost sales, lost leads, and lost trust. Faster detection means faster recovery.
The worst signal is a client email asking if you know their site is down. Proactive monitoring prevents this.
A down alert without SSL, response time, and health context makes triage harder.
How It Works
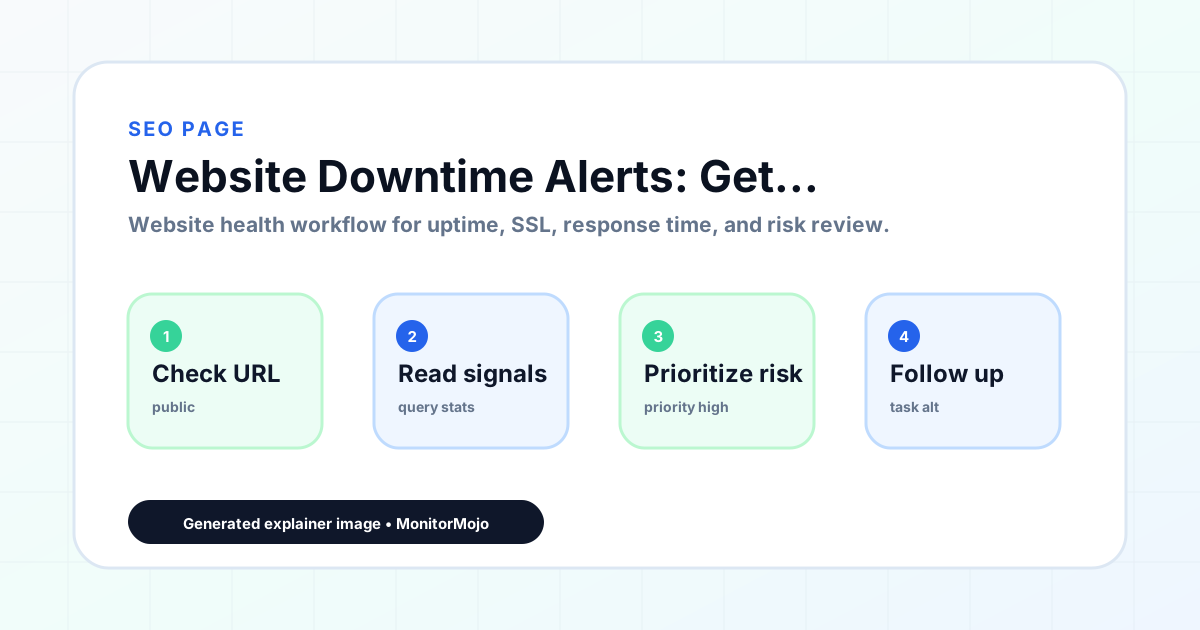
Enter the website, subdomain, or client property you need to protect.
Run a real reachability, HTTPS/SSL, response time, and configured health check.
Use the returned signals to decide what to fix before a browser error or complaint.
Features
Run uptime, SSL, response time, and security header checks anytime and see exactly what needs attention.
Verify websites are reachable and catch downtime fast.
Know when SSL certificates are expiring or have configuration issues.
Schedule checks with the CLI or API and pipe results into Slack, email, or a webhook you control.
Who This Is For
Stay informed about client site issues across your portfolio.
Check the sites you maintain and pipe results into your own alerts so you can respond fast.
Check your business website on a schedule so you're not the last to know when it's down.
Workflow Guide
MonitorMojo runs real uptime, SSL, response time, and security header checks on demand and saves the results to your check history. Schedule checks with the CLI or API and route the output to your own Slack, email, or webhook alerts to know when something needs attention.
In practice, that means reviewing SSL certificate status, certificate expiry windows, renewal ownership, and post-renewal confirmation from one repeatable process instead of waiting for site owners and small teams to hear about a problem secondhand. A check can show whether a URL is reachable, whether SSL appears valid, how quickly the server responds, and whether selected headers are present — it does not replace a security audit or an incident-response team, but it makes the underlying signals visible before they turn into a bigger issue.
This is built for site owners and small teams — specifically for the moment of running a routine check before a visitor finds the problem first. Every minute a website is down can mean lost sales, lost leads, and lost trust. Faster detection means faster recovery. The same workflow is reusable by anyone with a public URL tied to revenue, leads, or reputation.
Start by listing the URLs that actually matter for running a routine check before a visitor finds the problem first — not every page on the site, just the ones tied to revenue, signups, or trust. Define the check types for each: reachability, HTTP status, HTTPS/SSL status and expiry window, response time, redirects, and security header presence.
Set a cadence that matches the risk: a monthly review for low-traffic pages, a check right after every deploy for anything tied to revenue. When something fails, triage before assuming cause — hosting, DNS, SSL, code, cache, or a third-party script could all be responsible. Record an owner and a next review date, then re-check after the fix ships.
Use this template for every review: [URL], [Check Type], [Status], [Issue], [Priority], [Owner], [Detected Date], [Next Review Date]. Describe what the check observed before assigning a root cause — 'response time increased' is a fact, 'hosting is the problem' is a guess until confirmed.
For a recurring report, group findings by reachability, SSL, response time, and security headers, and say plainly when a signal showed no issue rather than implying full coverage.
The most common miss for site owners and small teams is checking only the homepage while a checkout, signup, or booking flow silently breaks. A close second is assuming SSL auto-renewal always works — it can fail quietly, and an external check is the only way to catch it before a browser warning does. The biggest framing mistake is treating one clean check as proof the whole site is covered.
Picture running a routine check before a visitor finds the problem first. A scheduled check flags that a key page is slower than its usual baseline and a security header is missing. Run uptime, SSL, response time, and security header checks anytime and see exactly what needs attention. Instead of guessing, the team logs the observation, assigns an owner, and re-checks after the fix — turning "something feels off" into a closed-loop task with a timestamp attached.
MonitorMojo runs the checks behind website downtime alerts and monitoring — reachability, SSL, response time, and security headers — from one dashboard, with an API and CLI for teams that want it scripted into an existing workflow. Credit-based checks make it practical to run a review exactly when it matters: before a client call, after a deploy, or the moment someone asks whether the site is healthy.
FAQ
MonitorMojo runs on-demand uptime, SSL, response time, and security header checks and saves the results to your check history. To get notified automatically today, schedule checks with the CLI or API and connect the output to your own Slack, email, or webhook alerts. In-app automated alerting is in preview and currently uses sample data.
MonitorMojo checks for website downtime, SSL certificate issues, slow response times, and security header problems. You can schedule these checks yourself and route the results to any alert channel you already use, such as Slack, email, or a webhook.
Because checks run through the CLI or API, you control the thresholds and logic in your own scripts or automation today. In-app alert configuration is part of the automated-monitoring preview and is not yet generally available.