MonitorMojo Blog
Response Time Audit Checklist
Server response time is a key signal for website health — it affects visitor experience, search engine rankings, and conversion rates. A response time audit identifies whether a site is performing within acceptable ranges, whether performance has changed over time, and whether there are any server or configuration issues contributing to slowness. This expanded guide explains the practical monitoring workflow behind the topic, who should use it, what to check, how to document findings, and how to turn website health signals into useful client, developer, API, CLI, or AI-agent workflows without overstating what monitoring can prove.
What Response Time Audits Measure
Response time in a monitoring context measures how long the server takes to respond to an initial HTTP request — Time to First Byte (TTFB). This is distinct from full page load time, which includes loading all resources. TTFB is a server-side metric and the most direct indicator of server health.
A high TTFB means the server is slow to process requests — which can indicate server overload, database issues, a slow backend, or a misconfigured caching layer.
Response time also varies based on where the check is run relative to the server location. When comparing response times over time, consistency matters more than absolute numbers.
Response Time Audit Checklist
Use this checklist to review response time for each site in scope.
- Server responds within 10 seconds (any longer suggests a serious issue)
- Response time is under 3 seconds (flag as warning if over)
- Response time is under 2 seconds (preferred benchmark for most sites)
- Response time is under 1 second (note as a positive finding)
- Response time is consistent across multiple checks (not highly variable)
- Response time has not increased significantly vs. previous audit
- No timeout errors observed during the check window
- Caching is enabled (if applicable) and appears functional
- CDN is in use (if applicable) and serving from edge locations
- No recent hosting or infrastructure changes that might explain slowness
- Response time trend: improving, stable, or degrading over time
Common Causes of Slow Response Time
Unoptimized database queries are one of the most common causes of slow TTFB on WordPress and CMS-based sites. A plugin that runs expensive queries on every page load will slow every response.
Server resource limits on shared hosting are another common culprit. A site that has outgrown its hosting plan will respond slowly during peak traffic and may return 503 errors when overloaded. An upgrade to VPS or managed hosting is the typical recommendation.
Missing or misconfigured caching is a third common cause. A site without page caching serves every page from scratch on every request. Enabling object caching, page caching, and CDN edge caching can dramatically improve TTFB.
How to Report Response Time Findings
Frame response time findings in terms of visitor impact. "Your site takes 4.2 seconds to respond — visitors often leave pages that take more than 3 seconds to load" is more compelling than "TTFB is 4,200ms."
Compare current response time to the previous audit period. If response time has increased significantly, flag it as a trend worth investigating.
Be careful about making performance guarantees. Response time depends on hosting, server load, network conditions, and site configuration — all outside full agency control. Frame recommendations as "we recommend investigating" rather than "we will fix this to X seconds."
How MonitorMojo Helps
MonitorMojo records server response time as part of every health check. Use the response time result to populate the checklist above and identify whether any flags apply.
Historical response time data lets you track trends over time. A site averaging 1.5 seconds six months ago and now averaging 4 seconds has a trend worth investigating.
Adapt response time recommendations to the actual hosting setup. A site on shared hosting has different optimization options than a site on managed WordPress hosting or a VPS.
What this workflow means
Response Time Audit Checklist is best understood as a repeatable website health workflow, not a promise that every outage or configuration issue will be avoided. A response time audit checklist for reviewing website performance, identifying slow pages, and flagging performance risks for client reports.
In practice, this workflow centers on server response time, deployment changes, hosting constraints, caching behavior, and third-party dependencies. Each check is planning input: it can show that the site is reachable, that a certificate has a given expiry window, that response time has shifted, or that a header is missing. It cannot prove root cause by itself or replace a human response. The value is in making the review consistent enough that site owners and small teams can spot issues before someone downstream has to ask about them.
Who should use this
This is most useful for site owners and small teams. Agencies reviewing website performance as part of care plans or audits
Beyond that primary audience, the same checks are reusable by anyone with a public-facing URL that matters to revenue, leads, or reputation: a recurring review is cheap insurance compared to hearing about the problem from a client or customer first.
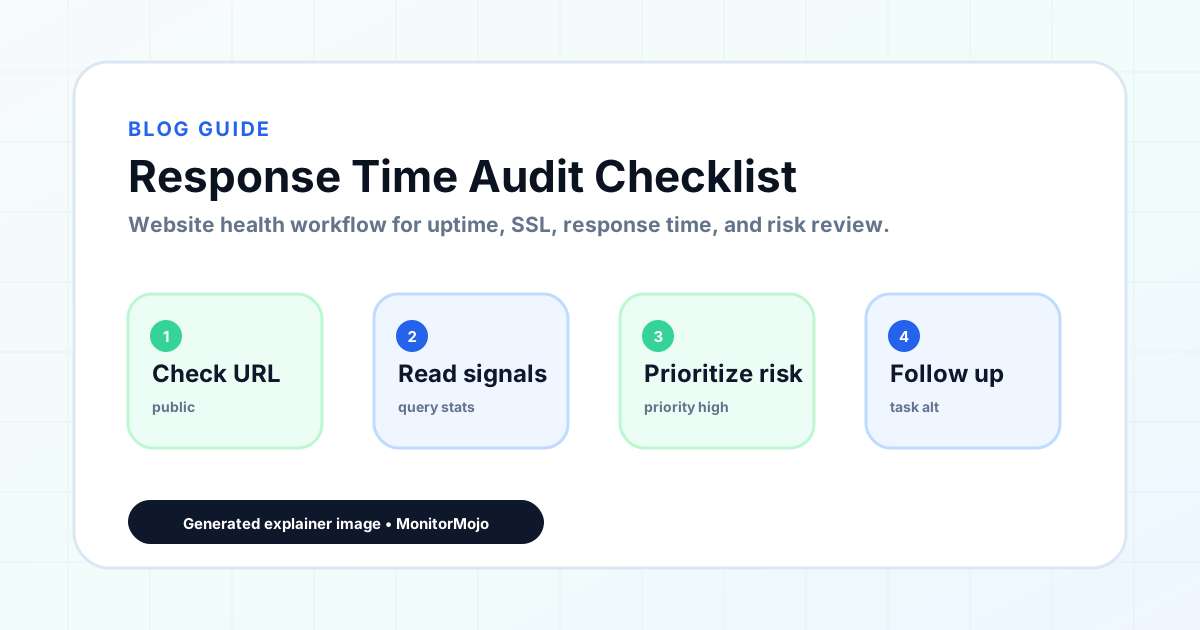
Step-by-step monitoring workflow
Start by listing the URLs that actually matter instead of just the homepage — for a small team doing a routine check before something breaks in front of a visitor, that usually means the pages tied to revenue, signups, or trust, not every page on the site.
Next, define the check types for each URL: reachability, HTTP status, HTTPS/SSL certificate status and expiry window, response time, redirect behavior, and security header presence. For API, CLI, and AI-agent workflows, document which endpoint or command runs the check and where the result is stored.
Set a cadence that matches the risk — a low-traffic page may only need a monthly look, while a page tied to revenue or signups deserves a check after every deployment and before any campaign or launch.
Record what you find with a consistent format: URL, check type, status, issue, owner, detected date, and next review date. Then say what actually happened in plain language — a check can surface a symptom, but site owners and small teams still need to confirm the cause.
- Choose the URLs that matter most to visitors, clients, revenue, and operations.
- Run uptime, SSL, response time, and security header checks on a consistent schedule.
- Triage failed or risky checks by likely owner: hosting, DNS, SSL, code, platform, or third party.
- Record notes in a repeatable format so future reviews do not start from scratch.
- Send a plain-language summary with the issue, impact, owner, and next review date.
- Run a confirmation check after remediation so there is an external result to reference.
Checklist or template
Use this template for recurring reviews: [URL], [Check Type], [Status], [Issue], [Priority], [Owner], [Detected Date], [Resolved Date], [Next Review Date]. Add a one-line summary at the top: what changed, what needs attention, and who owns the next step.
For site owners and small teams, group findings into the four signals that matter most: reachability, SSL status, response time, and security headers. Where nothing needs action, say the check found no issue in that area rather than implying full coverage.
- [URL]: the exact page or endpoint checked.
- [Check Type]: uptime, SSL, response time, headers, API, CLI, or agent workflow.
- [Status]: pass, review, failed, blocked, or needs human investigation.
- [Issue]: the observable symptom, not an unsupported root-cause claim.
- [Owner]: agency, developer, host, DNS provider, client, or third-party vendor.
- [Next Review Date]: when the team should confirm status again.
Common mistakes
The most common mistake is monitoring only the homepage while a checkout, signup, or booking flow silently breaks. Another is assuming SSL auto-renewal always works — it can fail quietly, and an external check is the only way to catch that before a browser warning does.
For site owners and small teams specifically, the recurring miss is treating one clean check as proof the whole site is fine, or fixing an issue without ever writing down what happened — which means the next person repeats the same investigation from zero.
- Tracking too many low-value URLs while missing the ones that matter.
- Skipping notes after an issue is resolved.
- Reporting a status without an owner or next step attached.
- Assuming automation can resolve an incident without human review.
- Treating one clean check as proof that every risk is covered.
Practical example
Consider a small team doing a routine check before something breaks in front of a visitor. A scheduled check flags that the site is slower than its usual baseline and that a security header is missing. Instead of guessing, the team logs the observation with a timestamp, assigns an owner, and re-checks after the fix ships — turning a vague "something feels off" into a specific, closed-loop task.
How MonitorMojo helps
MonitorMojo runs website health checks that combine reachability, SSL certificate status, response time, and security header presence in one workspace, so this workflow doesn't require stitching together several separate tools.
The API and CLI make the same checks scriptable for site owners and small teams who want them wired into an existing process, while credit-based checks keep it practical to run reviews exactly when they matter — before a client call, after a deploy, or when someone asks whether the site is healthy. Results still depend on hosting, DNS, and how quickly the responsible team acts on what the check finds.
Who this is for
- Agencies reviewing website performance as part of care plans or audits
- Freelancers who want to include performance checks in monthly client reports
- Web professionals who need to document response time trends for clients
- Anyone investigating slow website load times for a client or their own site
Frequently Asked Questions
What is an acceptable server response time?
Under 2 seconds is generally acceptable. Under 1 second is excellent. Over 3 seconds warrants investigation. Ecommerce and conversion-focused sites should aim for the lower end of the range.
How is response time different from page load time?
Response time (TTFB) measures how long the server takes to send the first byte. Page load time includes downloading all resources. TTFB is a server health indicator; page load time includes frontend factors.
What causes response time to increase over time?
Common causes include database growth, increased traffic, plugin bloat, missing or degraded caching, and hosting resource limits being reached. Investigating trends requires looking at what changed in the period before the slowdown.
Can this prevent every issue with the site?
No. Monitoring helps site owners and small teams detect website health signals and organize follow-up, but it does not prevent every outage, SSL issue, slow response, or third-party failure. The result still depends on hosting, DNS, infrastructure, and how quickly the responsible team investigates and responds.
What should a monitoring report include?
The URL, check type, current status, detected issue, priority, owner, detected date, resolved date if applicable, and the next review date. Keep the language tied to what the check actually observed, especially when the root cause still needs developer, host, or platform review.
Does this replace a full security audit?
No. It covers surface-level signals — reachability, SSL, response time, and security headers — not a full security audit, penetration test, or infrastructure review. Treat it as an early-warning layer, not a compliance substitute.