MonitorMojo Blog
Slow Website Response Plan for Agencies and Developers
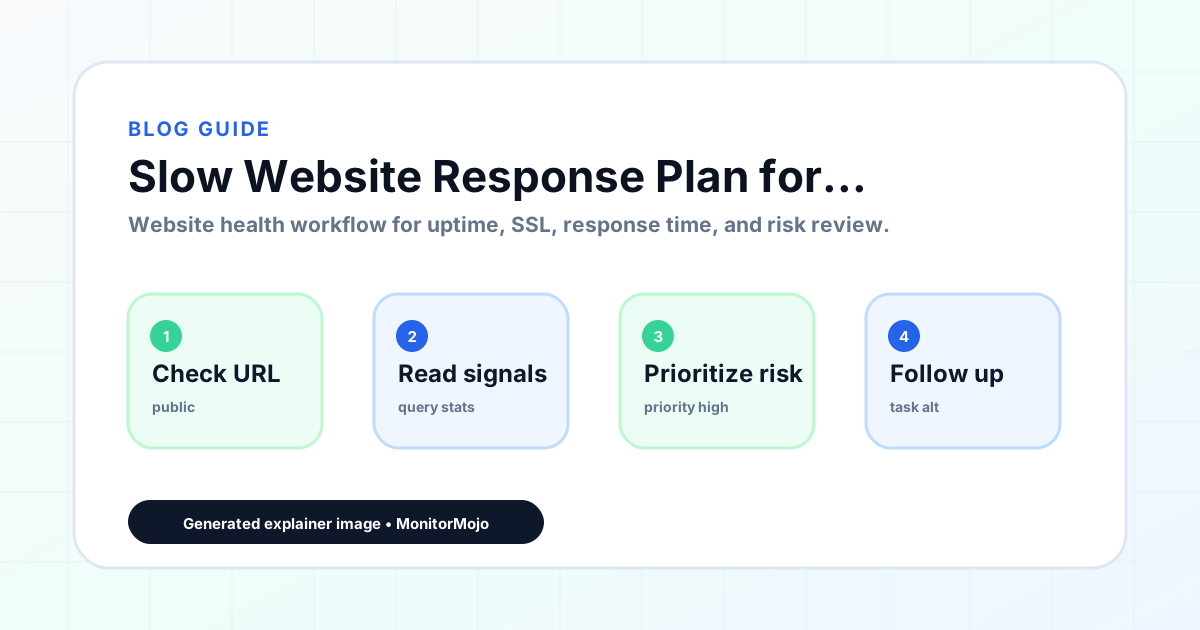
A slow site is a different problem from a down site: nothing is technically broken, so there is no hard failure to point at, only a creeping sense that pages take too long. This playbook is specifically for that gradual-degradation scenario, where the diagnostic challenge is figuring out when 'slow' started and what changed around that time, rather than confirming an obvious outage. This expanded guide explains the practical monitoring workflow behind the topic, who should use it, what to check, how to document findings, and how to turn website health signals into useful client, developer, API, CLI, or AI-agent workflows without overstating what monitoring can prove.
Confirming Slowness Is Real, Not Perceived
Before investigating causes, get an objective response-time number. A single person's impression of 'the site feels slow today' is unreliable, since local network conditions, device performance, and even the specific page they were on all affect that impression. Run an on-demand check to get an actual response-time figure to compare against.
Compare that number to what the site normally measures. If you have not been tracking response time regularly, you do not have a baseline to compare against, which is itself worth fixing going forward. A baseline turns 'feels slow' into 'objectively 3x slower than two weeks ago.'
If a client reports slowness but a check shows normal response time, do not dismiss the report outright. Ask which specific page and roughly what time of day they experienced it, and check that specific page rather than only the homepage, since an average site-wide response time can look fine while one particular page is genuinely slow.
Narrowing Down When It Started
Performance regressions are rarely instant; they are usually a step change tied to one event, or a slow creep tied to growth. Check your deploy history first, since a single deploy that added a heavy script, an unoptimized image, or an inefficient database query is the most common and most fixable cause. Check hosting and traffic patterns next, since a genuine increase in traffic or content volume can push response times up without any code change at all.
If check history shows response time was fine a week ago and elevated today, narrow the window: what deployed, what content was added, and what third-party scripts or embeds changed in that window.
Step Change Versus Slow Creep
These two patterns point at different causes and deserve different investigation approaches. A step change, where response time was fine yesterday and clearly worse today, almost always maps to a specific event: a deploy, a configuration change, or a sudden spike in traffic. This is the easier pattern to diagnose, since check history shows exactly where the line moved.
A slow creep, where response time drifts upward gradually over weeks or months, is harder to pin to a single cause and often points at accumulating content (more images, more embedded media, a growing database that queries take longer to search), or a slow accumulation of third-party scripts added one at a time over months, each individually too small to notice.
For a slow creep, comparing response time against a much older baseline, from three or six months ago rather than last week, often makes the trend obvious in a way that week-over-week comparisons miss entirely.
Where to Look for the Cause
Once you know roughly when it started, the usual suspects are the same short list every time: a slow database query introduced by a recent change, an unoptimized or newly added large image or video, a new third-party script (analytics, chat widgets, ad tags) that blocks rendering, or server resource limits being approached under normal load.
Prioritize by page, not just by site average. A slow checkout or login page matters more than a slow About page, even if the average across the whole site looks similar.
It is worth checking each suspect roughly in order of how easy it is to rule out. Removing a recently added third-party script temporarily and re-checking takes minutes. Profiling a database query for slowness takes longer and usually requires more direct access to the application. Start with the cheap checks before committing time to the expensive ones.
- Recent deploys or code changes
- New or unoptimized images and media
- Newly added third-party scripts or embeds
- Database query performance
- Server or hosting resource limits
Verifying a Fix Actually Worked
Once you have made a change (compressed an image, removed a script, optimized a query), do not trust a single fast check as proof it worked. Response time can vary between individual requests due to caching, server load at that exact moment, or network conditions, so one good result can be a fluke rather than evidence of a real fix.
Run several checks spread across a few hours, ideally including a period of normal or peak traffic, and compare the pattern to the baseline from before the fix. If a caching layer is involved, be aware that a cached response can look artificially fast; a check of a rarely visited page or a forced cache bypass gives a more honest read of the underlying performance.
Document what the fix actually was, even briefly. Six months from now, when a similar slowdown appears, that record of 'we removed the tracking pixel and response time dropped from 2.1s to 0.9s' is far more useful than trying to remember what worked last time from memory.
Common Mistakes
Chasing the problem without a baseline is the most common mistake; without knowing what 'normal' response time looked like, every fix attempt is a guess at whether it helped. Optimizing the homepage while ignoring that the checkout or signup page (the pages that actually matter for conversion) got slower is a frequent misdirection of effort.
Blaming the server or host first, when a newly added third-party script is actually the culprit, wastes time upgrading infrastructure that was never the bottleneck. And declaring victory after one fast check, without confirming the improvement holds over several checks across different times of day, risks missing a regression that only shows up under real traffic.
Fixing the symptom (adding caching to mask a slow query, for example) without addressing the underlying cause papers over the problem temporarily; it tends to resurface, often worse, once traffic grows or the cache is invalidated for another reason.
How MonitorMojo Helps
MonitorMojo measures response time on every check, giving you the objective number this playbook starts with. Check history lets you look back and pin down roughly when response time started climbing, which narrows your investigation to the deploys and changes around that window instead of guessing blindly.
Run checks via the API or CLI right after a deploy to catch a regression immediately, rather than waiting for a client or user to notice. Because pricing is credit-based per completed check, running a check after every deploy for every client site is affordable without a fixed monthly monitoring cost per site.
What this workflow means
Slow Website Response Plan for Agencies and Developers is best understood as a repeatable website health workflow, not a promise that every outage or configuration issue will be avoided. How to confirm a gradual performance regression is real, narrow down when it started, and find the usual causes: recent deploys, unoptimized media, or new third-party scripts.
In practice, this workflow centers on server response time, deployment changes, hosting constraints, caching behavior, and third-party dependencies. Each check is planning input: it can show that a client's site is reachable, that a certificate has a given expiry window, that response time has shifted, or that a header is missing. It cannot prove root cause by itself or replace a human response. The value is in making the review consistent enough that web agencies and client-services teams can spot issues before someone downstream has to ask about them.
Who should use this
This is most useful for web agencies and client-services teams. Developers investigating a gradual performance regression, not an outage
Beyond that primary audience, the same checks are reusable by anyone with a public-facing URL that matters to revenue, leads, or reputation: a recurring review is cheap insurance compared to hearing about the problem from a client or customer first.
Step-by-step monitoring workflow
Start by listing the URLs that actually matter instead of just the homepage — for an agency reviewing a portfolio of client sites before a monthly report, that usually means the pages tied to revenue, signups, or trust, not every page on the site.
Next, define the check types for each URL: reachability, HTTP status, HTTPS/SSL certificate status and expiry window, response time, redirect behavior, and security header presence. For API, CLI, and AI-agent workflows, document which endpoint or command runs the check and where the result is stored.
Set a cadence that matches the risk — a low-traffic page may only need a monthly look, while a page tied to revenue or signups deserves a check after every deployment and before any campaign or launch.
Record what you find with a consistent format: URL, check type, status, issue, owner, detected date, and next review date. Then say what actually happened in plain language — a check can surface a symptom, but web agencies and client-services teams still need to confirm the cause.
- Choose the URLs that matter most to visitors, clients, revenue, and operations.
- Run uptime, SSL, response time, and security header checks on a consistent schedule.
- Triage failed or risky checks by likely owner: hosting, DNS, SSL, code, platform, or third party.
- Record notes in a repeatable format so future reviews do not start from scratch.
- Send a plain-language summary with the issue, impact, owner, and next review date.
- Run a confirmation check after remediation so there is an external result to reference.
Checklist or template
Use this template for recurring reviews: [URL], [Check Type], [Status], [Issue], [Priority], [Owner], [Detected Date], [Resolved Date], [Next Review Date]. Add a one-line summary at the top: what changed, what needs attention, and who owns the next step.
For web agencies and client-services teams, group findings into the four signals that matter most: reachability, SSL status, response time, and security headers. Where nothing needs action, say the check found no issue in that area rather than implying full coverage.
- [URL]: the exact page or endpoint checked.
- [Check Type]: uptime, SSL, response time, headers, API, CLI, or agent workflow.
- [Status]: pass, review, failed, blocked, or needs human investigation.
- [Issue]: the observable symptom, not an unsupported root-cause claim.
- [Owner]: agency, developer, host, DNS provider, client, or third-party vendor.
- [Next Review Date]: when the team should confirm status again.
Common mistakes
The most common mistake is monitoring only the homepage while a checkout, signup, or booking flow silently breaks. Another is assuming SSL auto-renewal always works — it can fail quietly, and an external check is the only way to catch that before a browser warning does.
For web agencies and client-services teams specifically, the recurring miss is treating one clean check as proof the whole site is fine, or fixing an issue without ever writing down what happened — which means the next person repeats the same investigation from zero.
- Tracking too many low-value URLs while missing the ones that matter.
- Skipping notes after an issue is resolved.
- Reporting a status without an owner or next step attached.
- Assuming automation can resolve an incident without human review.
- Treating one clean check as proof that every risk is covered.
Practical example
Consider an agency reviewing a portfolio of client sites before a monthly report. A scheduled check flags that a client's site is slower than its usual baseline and that a security header is missing. Instead of guessing, the team logs the observation with a timestamp, assigns an owner, and re-checks after the fix ships — turning a vague "something feels off" into a specific, closed-loop task.
How MonitorMojo helps
MonitorMojo runs website health checks that combine reachability, SSL certificate status, response time, and security header presence in one workspace, so this workflow doesn't require stitching together several separate tools.
The API and CLI make the same checks scriptable for web agencies and client-services teams who want them wired into an existing process, while credit-based checks keep it practical to run reviews exactly when they matter — before a client call, after a deploy, or when someone asks whether a client's site is healthy. Results still depend on hosting, DNS, and how quickly the responsible team acts on what the check finds.
Who this is for
- Developers investigating a gradual performance regression, not an outage
- Agencies fielding a client complaint that 'the site feels slow'
- Teams that added a third-party script or embed and want to confirm it did not hurt speed
- Anyone without an existing response-time baseline to compare against
Frequently Asked Questions
How do I know if my site is actually slower or if it just feels that way?
Run a check to get an objective response-time number and compare it against your historical baseline. A single subjective impression is not reliable evidence on its own.
What usually causes a website to gradually slow down?
A recent deploy with a heavy script or query, newly added large images or media, a new third-party embed, or growing traffic and content volume pushing against server resource limits.
Does MonitorMojo tell me automatically when response time degrades?
No. It measures response time on each check you run. For ongoing tracking, schedule checks yourself via the API or CLI and compare results over time, or route them into your own alerting tool.
Should every page on the site have the same performance priority?
No. Prioritize pages that affect conversion or core functionality, like checkout or login, over lower-traffic pages, even if the site-wide average response time looks similar.
Does fixing the slowness guarantee it will not happen again?
No. It resolves the current regression. Preventing a recurrence means checking response time after future deploys and before adding new third-party scripts, not assuming a one-time fix is permanent.
Can this prevent every issue with a client's site?
No. Monitoring helps web agencies and client-services teams detect website health signals and organize follow-up, but it does not prevent every outage, SSL issue, slow response, or third-party failure. The result still depends on hosting, DNS, infrastructure, and how quickly the responsible team investigates and responds.