MonitorMojo Blog
Uptime Monitoring KPIs That Actually Matter
Uptime percentage alone tells an incomplete story. A site can post 99.9% uptime with one bad afternoon, or with ten short blips, and the operational reality behind those two scenarios is completely different. This guide focuses specifically on the three metrics that, together, actually describe uptime performance: the percentage itself, incident count, and mean time to resolution (MTTR). This expanded guide explains the practical monitoring workflow behind the topic, who should use it, what to check, how to document findings, and how to turn website health signals into useful client, developer, API, CLI, or AI-agent workflows without overstating what monitoring can prove.
Uptime Percentage: Useful but Incomplete Alone
Uptime percentage is (total time minus downtime) divided by total time, for a defined period. It is the right headline number, but it flattens very different situations into the same figure. A single four-hour outage and eight thirty-minute outages can both produce a similar monthly percentage, even though the second pattern usually points at a recurring, unresolved cause.
Always pair the percentage with the period it covers. A monthly uptime percentage and an all-time uptime percentage can tell very different stories, and reporting the flattering one without saying which it is erodes trust once someone checks.
It also helps to look at uptime percentage across several consecutive periods rather than one period in isolation. A single bad month next to five good ones reads very differently than a slow month-over-month decline, even if the most recent number is identical in both cases.
Incident Count: The Metric That Reveals Patterns
Count incidents, not just downtime minutes. Rising incident count with stable uptime percentage is an early warning sign, since it usually means something is intermittently failing and getting lucky on recovery time, a pattern that often precedes a longer outage.
Break incidents down by rough cause where you can (hosting, deploy-related, DNS, third-party dependency). This turns a raw count into something you can act on, rather than just a number that goes up.
A Realistic Target Range, Not a Universal Standard
Resist the temptation to adopt an industry-wide uptime target like 99.9% as a universal standard without considering what is actually realistic for a given site's hosting setup. A site on a budget shared host has a different realistic ceiling than one on dedicated, redundant infrastructure, and holding both to the same target invites either constant disappointment or a dishonestly generous definition of 'uptime.'
Instead, establish each site's own realistic baseline over a few months of measurement, then track whether it is improving, holding steady, or degrading relative to that baseline. A site that consistently delivers 99.5% given its hosting constraints, and holds that steady, is a healthier signal than a site nominally targeting 99.9% but swinging unpredictably between 99.99% and 98.5% month to month.
MTTR: The Metric That Reflects Your Own Process
Mean time to resolution measures the average time from an incident starting to it being resolved. Unlike uptime percentage, which is partly at the mercy of your hosting provider, MTTR is mostly a reflection of your own detection speed and response process, which makes it the more directly improvable of the three.
A high MTTR with low incident count often points at slow detection (you did not know it was down for a while) rather than slow fixing. A low MTTR with high incident count often points at a fast, well-drilled response process dealing with a chronically unstable underlying system.
Because MTTR is the metric most within your own control, it is usually the most useful one to set an internal improvement goal around. Rather than promising a client a specific MTTR, which depends partly on factors like when an incident happens to occur, track it internally as a measure of whether your own detection and response process is getting faster or slower over time.
- Uptime %: overall reliability over a period
- Incident count: frequency and pattern of failures
- MTTR: how fast incidents get resolved once detected
- Time-to-detection: how long before you knew about it (a component of MTTR worth isolating)
Using These Three Metrics Together in a Retro
The real value of tracking uptime percentage, incident count, and MTTR together shows up in a monthly or quarterly internal retro, not in any single report. Look at the three side by side: is uptime percentage stable while incident count is climbing (a warning sign worth investigating before it becomes a longer outage)? Is MTTR climbing while incident count stays flat (a sign the response process itself is getting slower, perhaps due to team turnover or a growing site count per person)?
These combinations tell a story that no single number does on its own. A team that only ever looks at uptime percentage in isolation will miss both of these patterns until they show up as a client complaint.
For a portfolio of client sites, calculate all three per site rather than as one blended average across the whole portfolio. A blended average can hide a single problem client behind several stable ones, which delays noticing that one account needs real attention.
Bring these three numbers to the retro alongside a brief note on what changed operationally that period, such as a new team member, a new client onboarded, or a change in check frequency. Numbers without that operational context are harder to interpret correctly.
Common Mistakes
Reporting uptime percentage without incident count hides whether a good number came from genuine stability or a single lucky short outage. Not isolating time-to-detection from time-to-fix within MTTR makes it hard to tell whether a slow MTTR is a detection problem or a response problem, which need different fixes.
Comparing MTTR across sites with very different check frequencies is misleading; a site checked hourly will show faster apparent detection than one checked daily, independent of actual response speed.
Averaging these three metrics across an entire portfolio, rather than calculating them per site, hides which specific accounts are actually driving a poor result.
How MonitorMojo Helps
Each on-demand MonitorMojo check returns a clear reachability result, timestamped and saved to check history, which is the raw data uptime percentage, incident count, and MTTR are all calculated from. Because checks run on your own schedule via the API or CLI, you control the check interval, and a tighter interval directly improves your effective time-to-detection.
Pulling a period's worth of check history lets you calculate all three metrics for a client review or an internal retro without re-deriving them from scratch each time.
What this workflow means
Uptime Monitoring KPIs That Actually Matter is best understood as a repeatable website health workflow, not a promise that every outage or configuration issue will be avoided. Why uptime percentage alone is misleading, and how incident count and MTTR together give a more accurate picture of uptime performance.
In practice, this workflow centers on reachability, HTTP status, downtime triage, stakeholder updates, and confirmation checks. Each check is planning input: it can show that the site is reachable, that a certificate has a given expiry window, that response time has shifted, or that a header is missing. It cannot prove root cause by itself or replace a human response. The value is in making the review consistent enough that site owners and small teams can spot issues before someone downstream has to ask about them.
Who should use this
This is most useful for site owners and small teams. Agencies who want to explain uptime performance with more than one number
Beyond that primary audience, the same checks are reusable by anyone with a public-facing URL that matters to revenue, leads, or reputation: a recurring review is cheap insurance compared to hearing about the problem from a client or customer first.
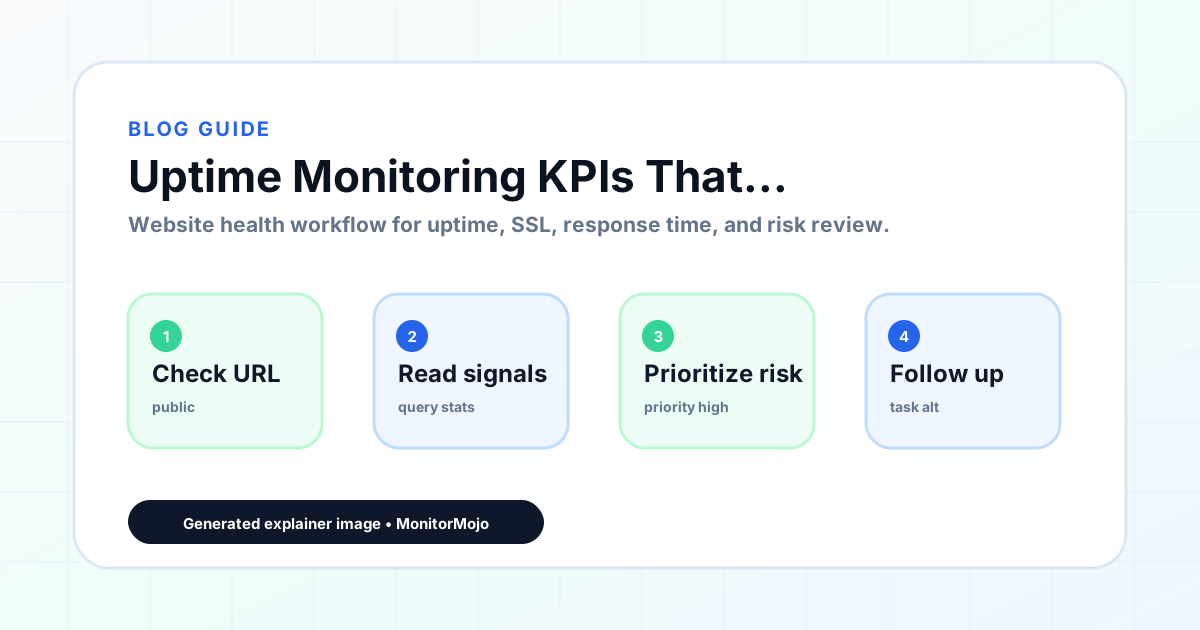
Step-by-step monitoring workflow
Start by listing the URLs that actually matter instead of just the homepage — for a small team doing a routine check before something breaks in front of a visitor, that usually means the pages tied to revenue, signups, or trust, not every page on the site.
Next, define the check types for each URL: reachability, HTTP status, HTTPS/SSL certificate status and expiry window, response time, redirect behavior, and security header presence. For API, CLI, and AI-agent workflows, document which endpoint or command runs the check and where the result is stored.
Set a cadence that matches the risk — a low-traffic page may only need a monthly look, while a page tied to revenue or signups deserves a check after every deployment and before any campaign or launch.
Record what you find with a consistent format: URL, check type, status, issue, owner, detected date, and next review date. Then say what actually happened in plain language — a check can surface a symptom, but site owners and small teams still need to confirm the cause.
- Choose the URLs that matter most to visitors, clients, revenue, and operations.
- Run uptime, SSL, response time, and security header checks on a consistent schedule.
- Triage failed or risky checks by likely owner: hosting, DNS, SSL, code, platform, or third party.
- Record notes in a repeatable format so future reviews do not start from scratch.
- Send a plain-language summary with the issue, impact, owner, and next review date.
- Run a confirmation check after remediation so there is an external result to reference.
Checklist or template
Use this template for recurring reviews: [URL], [Check Type], [Status], [Issue], [Priority], [Owner], [Detected Date], [Resolved Date], [Next Review Date]. Add a one-line summary at the top: what changed, what needs attention, and who owns the next step.
For site owners and small teams, group findings into the four signals that matter most: reachability, SSL status, response time, and security headers. Where nothing needs action, say the check found no issue in that area rather than implying full coverage.
- [URL]: the exact page or endpoint checked.
- [Check Type]: uptime, SSL, response time, headers, API, CLI, or agent workflow.
- [Status]: pass, review, failed, blocked, or needs human investigation.
- [Issue]: the observable symptom, not an unsupported root-cause claim.
- [Owner]: agency, developer, host, DNS provider, client, or third-party vendor.
- [Next Review Date]: when the team should confirm status again.
Common mistakes
The most common mistake is monitoring only the homepage while a checkout, signup, or booking flow silently breaks. Another is assuming SSL auto-renewal always works — it can fail quietly, and an external check is the only way to catch that before a browser warning does.
For site owners and small teams specifically, the recurring miss is treating one clean check as proof the whole site is fine, or fixing an issue without ever writing down what happened — which means the next person repeats the same investigation from zero.
- Tracking too many low-value URLs while missing the ones that matter.
- Skipping notes after an issue is resolved.
- Reporting a status without an owner or next step attached.
- Assuming automation can resolve an incident without human review.
- Treating one clean check as proof that every risk is covered.
Practical example
Consider a small team doing a routine check before something breaks in front of a visitor. A scheduled check flags that the site is slower than its usual baseline and that a security header is missing. Instead of guessing, the team logs the observation with a timestamp, assigns an owner, and re-checks after the fix ships — turning a vague "something feels off" into a specific, closed-loop task.
How MonitorMojo helps
MonitorMojo runs website health checks that combine reachability, SSL certificate status, response time, and security header presence in one workspace, so this workflow doesn't require stitching together several separate tools.
The API and CLI make the same checks scriptable for site owners and small teams who want them wired into an existing process, while credit-based checks keep it practical to run reviews exactly when they matter — before a client call, after a deploy, or when someone asks whether the site is healthy. Results still depend on hosting, DNS, and how quickly the responsible team acts on what the check finds.
Who this is for
- Agencies who want to explain uptime performance with more than one number
- Teams trying to figure out whether a reliability problem is a detection issue or a fixing issue
- Anyone comparing uptime performance across multiple client sites
- DevOps-minded developers who want MTTR as an actionable internal metric
Frequently Asked Questions
Why isn't uptime percentage enough on its own?
It flattens very different situations into one number. One long outage and several short ones can produce similar percentages while representing very different underlying problems.
What does a high incident count with stable uptime percentage usually mean?
It often signals an intermittent, unresolved issue that keeps recovering quickly by chance. That pattern frequently precedes a longer outage if the root cause is not addressed.
Is MTTR something MonitorMojo calculates for me automatically?
No. MonitorMojo provides the timestamped check results in check history; calculating MTTR from those results is something you do yourself, typically via the API or CLI pulling historical data.
How does check frequency affect these KPIs?
A tighter check interval improves apparent time-to-detection and gives a more precise uptime percentage, but costs more checks. Comparing MTTR across sites with very different check frequencies is not a fair comparison.
Do good uptime KPIs guarantee a reliable site going forward?
No. They describe past performance and help you spot patterns, but they do not prevent future outages or guarantee your hosting provider's continued reliability.
Can this prevent every issue with the site?
No. Monitoring helps site owners and small teams detect website health signals and organize follow-up, but it does not prevent every outage, SSL issue, slow response, or third-party failure. The result still depends on hosting, DNS, infrastructure, and how quickly the responsible team investigates and responds.