MonitorMojo Blog
Website Monitoring KPIs for Agencies and Website Owners
Before drilling into uptime-specific or SSL-specific metrics, it helps to see the whole board: what categories of KPIs exist for website monitoring, and which ones actually deserve a spot on a dashboard versus which ones are just numbers that look impressive. This is the overview; the uptime, SSL, and client-report KPI guides that follow each dig into one category in depth. This expanded guide explains the practical monitoring workflow behind the topic, who should use it, what to check, how to document findings, and how to turn website health signals into useful client, developer, API, CLI, or AI-agent workflows without overstating what monitoring can prove.
The Four KPI Categories
Availability metrics answer 'was the site up': uptime percentage, incident count, and MTTR fall here. Performance metrics answer 'was the site fast enough': response time, and how it trends over time, fall here. Security metrics answer 'were the basic protections in place': SSL certificate validity and security header presence fall here. Process metrics answer 'are we actually running our own workflow well': check frequency, report timeliness, and time-to-acknowledge an issue fall here.
Most teams over-invest in tracking availability and under-invest in tracking process, even though process metrics are often the most fixable. A team that checks its own sites consistently and reports on time is solving a different, more controllable problem than a team chasing a hosting provider's uptime record.
It is worth noting explicitly that these categories are a starting framework, not a rigid taxonomy. A specific business might reasonably add a fifth category, such as a conversion-adjacent metric, if that better reflects what actually matters for their particular sites.
- Availability: uptime %, incident count, MTTR
- Performance: response time and its trend
- Security: SSL validity, header presence
- Process: check frequency, report timeliness, time-to-acknowledge
Choosing Which KPIs Actually Belong on a Dashboard
A KPI earns a spot on a recurring dashboard if it changes your behavior when it moves. Uptime percentage passes this test, since a drop triggers investigation. A metric like 'total checks run this month' usually fails it, since it describes your own activity level rather than site health and rarely changes what you do next.
Keep the dashboard short. Five or six KPIs that get looked at every week beat fifteen that get ignored after the first month.
A useful filter question for any candidate metric is: if this number changed significantly next week, would anyone actually do something differently because of it? If the honest answer is no, the metric is interesting trivia rather than a KPI, and it belongs in an occasional deep-dive report rather than a recurring dashboard.
Matching KPIs to the Audience
Internal, technical KPIs (MTTR, check frequency, specific error codes) belong in your own operational review, not in a client-facing report. Client-facing KPIs should be the small handful that a non-technical person can interpret without explanation: uptime percentage, incident count, and a plain-language note on response time.
Confusing these two audiences is a common failure mode: sending a client a dashboard full of internal ops metrics, or worse, only tracking client-friendly metrics internally and losing the operational detail needed to actually diagnose problems.
How the Four Categories Interact
These categories are not fully independent; a problem in one often shows up as a symptom in another. A slow response time (performance) can sometimes trace back to a recent deploy that also introduced a reachability issue (availability), and a missing security header (security) frequently coincides with an infrastructure migration that also affected SSL configuration.
This is part of why treating website health as one combined check, rather than four completely separate monitoring tools, has a real diagnostic advantage: when something breaks, you can see whether it is isolated to one category or affecting several at once, which is itself a useful clue about the root cause. An issue that hits availability, security, and performance simultaneously usually points at an infrastructure-level change, while an issue isolated to just one category points at something more localized.
Keep this interaction in mind when reviewing KPIs together rather than one at a time. A dashboard that shows all four categories side by side, even briefly, surfaces these correlated shifts far more readily than four separate reports reviewed on their own schedules.
Starting Small and Adding KPIs Deliberately
For a team just starting to formalize monitoring, resist the urge to track all four categories in full depth from day one. A reasonable starting set is uptime percentage, response time, and SSL status, since together they answer the most common client question ('is my site okay') without requiring a process-metrics layer you may not need yet.
Add incident count and MTTR once you have enough incidents to make them meaningful; a single data point does not make a trend. Add process metrics like report timeliness once you are managing enough sites that consistency across accounts becomes its own challenge worth measuring.
This staged approach avoids building an elaborate KPI framework for a portfolio of three sites, where a simple manual check twice a week may answer every question a client actually has.
Common Mistakes
Tracking a long list of metrics because a tool happens to report them, rather than choosing metrics deliberately, produces a dashboard nobody actually reads. Treating every KPI as equally important dilutes attention away from the two or three that actually predict client-visible problems.
Not revisiting the KPI list as a site's risk profile changes (for example, after it starts processing payments) means the metrics that mattered at launch may no longer be the ones that matter now.
Adopting every KPI category at once before there is enough historical data to make any of them meaningful results in a dashboard of noisy, low-confidence numbers rather than a smaller set of numbers you actually trust.
How MonitorMojo Helps
Every MonitorMojo check returns the raw data behind all four KPI categories in one pass: reachability for availability, response time for performance, SSL status for security, and header presence for security. Check history holds that data over time, which is what turns a single check result into a trend line you can actually call a KPI.
The API and CLI let you pull this data into whatever dashboard or spreadsheet you already use for internal review, and client-ready summaries handle the narrower, audience-appropriate view for client reporting without extra manual work.
What this workflow means
Website Monitoring KPIs for Agencies and Website Owners is best understood as a repeatable website health workflow, not a promise that every outage or configuration issue will be avoided. An overview of the four website monitoring KPI categories (availability, performance, security, process) and how to choose which ones actually belong on a dashboard.
In practice, this workflow centers on uptime, SSL certificates, response time, security headers, website health summaries, and monthly review notes. Each check is planning input: it can show that a client's site is reachable, that a certificate has a given expiry window, that response time has shifted, or that a header is missing. It cannot prove root cause by itself or replace a human response. The value is in making the review consistent enough that web agencies and client-services teams can spot issues before someone downstream has to ask about them.
Who should use this
This is most useful for web agencies and client-services teams. Agencies deciding which metrics belong on an internal dashboard versus a client report
Beyond that primary audience, the same checks are reusable by anyone with a public-facing URL that matters to revenue, leads, or reputation: a recurring review is cheap insurance compared to hearing about the problem from a client or customer first.
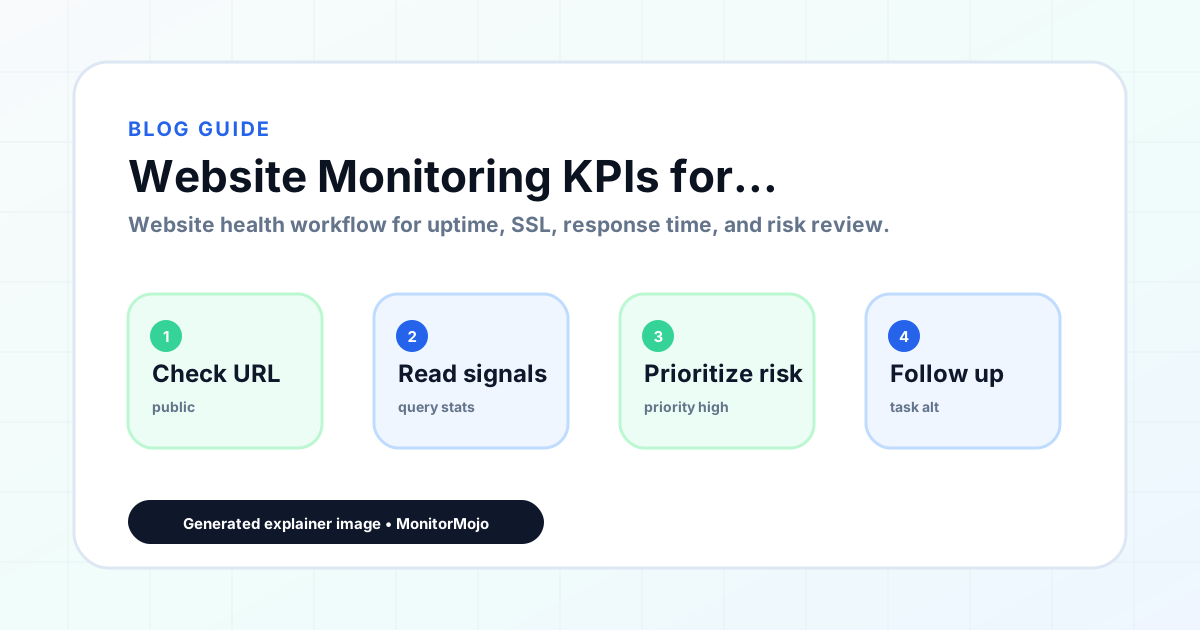
Step-by-step monitoring workflow
Start by listing the URLs that actually matter instead of just the homepage — for an agency reviewing a portfolio of client sites before a monthly report, that usually means the pages tied to revenue, signups, or trust, not every page on the site.
Next, define the check types for each URL: reachability, HTTP status, HTTPS/SSL certificate status and expiry window, response time, redirect behavior, and security header presence. For API, CLI, and AI-agent workflows, document which endpoint or command runs the check and where the result is stored.
Set a cadence that matches the risk — a low-traffic page may only need a monthly look, while a page tied to revenue or signups deserves a check after every deployment and before any campaign or launch.
Record what you find with a consistent format: URL, check type, status, issue, owner, detected date, and next review date. Then say what actually happened in plain language — a check can surface a symptom, but web agencies and client-services teams still need to confirm the cause.
- Choose the URLs that matter most to visitors, clients, revenue, and operations.
- Run uptime, SSL, response time, and security header checks on a consistent schedule.
- Triage failed or risky checks by likely owner: hosting, DNS, SSL, code, platform, or third party.
- Record notes in a repeatable format so future reviews do not start from scratch.
- Send a plain-language summary with the issue, impact, owner, and next review date.
- Run a confirmation check after remediation so there is an external result to reference.
Checklist or template
Use this template for recurring reviews: [URL], [Check Type], [Status], [Issue], [Priority], [Owner], [Detected Date], [Resolved Date], [Next Review Date]. Add a one-line summary at the top: what changed, what needs attention, and who owns the next step.
For web agencies and client-services teams, group findings into the four signals that matter most: reachability, SSL status, response time, and security headers. Where nothing needs action, say the check found no issue in that area rather than implying full coverage.
- [URL]: the exact page or endpoint checked.
- [Check Type]: uptime, SSL, response time, headers, API, CLI, or agent workflow.
- [Status]: pass, review, failed, blocked, or needs human investigation.
- [Issue]: the observable symptom, not an unsupported root-cause claim.
- [Owner]: agency, developer, host, DNS provider, client, or third-party vendor.
- [Next Review Date]: when the team should confirm status again.
Common mistakes
The most common mistake is monitoring only the homepage while a checkout, signup, or booking flow silently breaks. Another is assuming SSL auto-renewal always works — it can fail quietly, and an external check is the only way to catch that before a browser warning does.
For web agencies and client-services teams specifically, the recurring miss is treating one clean check as proof the whole site is fine, or fixing an issue without ever writing down what happened — which means the next person repeats the same investigation from zero.
- Tracking too many low-value URLs while missing the ones that matter.
- Skipping notes after an issue is resolved.
- Reporting a status without an owner or next step attached.
- Assuming automation can resolve an incident without human review.
- Treating one clean check as proof that every risk is covered.
Practical example
Consider an agency reviewing a portfolio of client sites before a monthly report. A scheduled check flags that a client's site is slower than its usual baseline and that a security header is missing. Instead of guessing, the team logs the observation with a timestamp, assigns an owner, and re-checks after the fix ships — turning a vague "something feels off" into a specific, closed-loop task.
How MonitorMojo helps
MonitorMojo runs website health checks that combine reachability, SSL certificate status, response time, and security header presence in one workspace, so this workflow doesn't require stitching together several separate tools.
The API and CLI make the same checks scriptable for web agencies and client-services teams who want them wired into an existing process, while credit-based checks keep it practical to run reviews exactly when they matter — before a client call, after a deploy, or when someone asks whether a client's site is healthy. Results still depend on hosting, DNS, and how quickly the responsible team acts on what the check finds.
Who this is for
- Agencies deciding which metrics belong on an internal dashboard versus a client report
- Website owners who want a starting KPI framework rather than tracking everything a tool offers
- Teams building a monitoring dashboard from scratch and unsure where to start
- Anyone whose current KPI list has grown too long to actually act on
Frequently Asked Questions
What are the four main categories of website monitoring KPIs?
Availability (uptime %, incidents, MTTR), performance (response time), security (SSL validity, header presence), and process (check frequency, report timeliness).
How many KPIs should be on a monitoring dashboard?
Five or six that get reviewed weekly are more useful than fifteen that get ignored. A KPI should earn its place by actually changing what you do when it moves.
Should client-facing and internal dashboards track the same KPIs?
No. Internal dashboards can include technical detail like MTTR and check frequency. Client-facing reports should stick to a small handful of plain-language metrics like uptime percentage and incident count.
Does MonitorMojo calculate these KPIs automatically?
MonitorMojo provides the underlying data (reachability, response time, SSL status, headers) from each check and saves it to check history. Turning that into a specific KPI dashboard is something you build using the API, CLI, or the saved check history.
Does tracking these KPIs guarantee better website reliability?
No. Tracking KPIs makes problems visible and trends measurable, but it does not fix the underlying causes on its own. Someone still has to act on what the numbers show.
Can this prevent every issue with a client's site?
No. Monitoring helps web agencies and client-services teams detect website health signals and organize follow-up, but it does not prevent every outage, SSL issue, slow response, or third-party failure. The result still depends on hosting, DNS, infrastructure, and how quickly the responsible team investigates and responds.