MonitorMojo Blog
Client Uptime SLA Report: What to Include
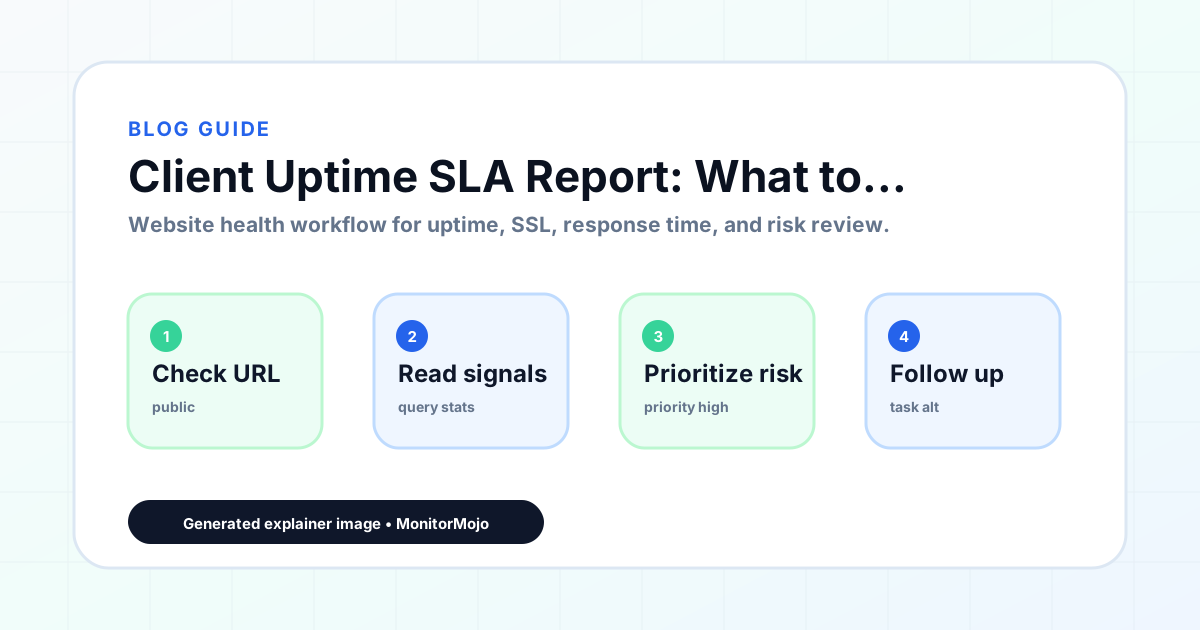
Tracking uptime internally is only half the job; the other half is turning that data into a report a non-technical client actually wants to read. This is a template for that specific document: what sections to include, how to phrase an incident without sounding evasive or overly alarming, and a fill-in-the-blank layout you can reuse every reporting period. This expanded guide explains the practical monitoring workflow behind the topic, who should use it, what to check, how to document findings, and how to turn website health signals into useful client, developer, API, CLI, or AI-agent workflows without overstating what monitoring can prove.
What Belongs in a Client-Facing Uptime Report
Lead with the headline number: uptime percentage for the period, in plain terms. Follow with incident count and, if any incidents occurred, a short plain-language description of each one, not a technical postmortem. Most clients care about three things: was the site up, if not, what happened, and what are you doing to prevent a repeat.
Close with a forward-looking note, even a short one. A report that only looks backward reads as a scorecard; a report that also says what you are watching for next period reads as active management.
Choosing the Right Format and Delivery Method
A short email is usually the right format for most small-business clients; it is quick to write, quick to read, and does not require the client to log into a separate portal or open an attachment. Save a more formal document or PDF format for enterprise clients or accounts that specifically request one for their own internal records.
Send from a consistent sender and with a consistent subject line format every period, so the client's inbox naturally groups past reports together and they can scan back through history easily if needed. A report that shows up from a different address or with an inconsistent subject line each time is harder for a client to find later.
If you manage the report through MonitorMojo's client-ready summaries, decide once whether you forward the summary directly or wrap it in your own short cover note; a brief personal line at the top ('Here's June's report, nothing to flag this month') often lands better than a summary sent with no framing at all.
A Reusable Report Template
The structure below works as a monthly template. Fill in the brackets with the period's actual numbers and keep the incident section brief; a client report is not the place for a full technical timeline.
Save the filled-in template each month, even after sending it, in a folder organized by client. Six months of past reports in one place is useful both for spotting your own long-term patterns and for quickly answering a client who asks how this month compares to a few months ago.
- Subject: [Client Name] Uptime Report - [Month/Year]
- Site(s) covered: [Site URL(s)]
- Uptime this period: [XX.X%]
- Incidents: [Number], totaling [XX minutes/hours] of downtime
- Summary: [1-2 sentence plain-language description per incident, or 'No incidents this period']
- Looking ahead: [What you are watching or changing next period]
Describing an Incident Without Sounding Evasive
Vague language like 'there was a brief issue' erodes trust faster than an honest description would. State what happened in plain terms (the site was unreachable for 12 minutes due to a hosting provider issue), what you did (confirmed the outage, contacted the host, verified recovery), and what changed to reduce the chance of a repeat, if anything did.
If the incident's cause was outside your control, such as a third-party hosting outage, say so plainly rather than implying it was your fault or dodging the question of cause entirely. Clients generally respond better to a direct, specific account than to a defensive one.
For a month with multiple incidents, resist the urge to combine them into one vague summary line. List each one separately with its own duration and cause, even if that makes the report slightly longer; a client evaluating whether their site had 'a rough month' needs to see the actual pattern, not a single averaged-out sentence.
A Worked Example
Consider a month with one 12-minute outage caused by a hosting provider issue. A weak version of this report says: 'The site had a brief issue this month but is running fine now.' A stronger version says: 'Uptime this period was 99.97%. One incident: the site was unreachable for 12 minutes on the 14th due to a hosting provider outage, confirmed via an independent check and resolved once the provider restored service. No action needed on our end, but we are keeping an eye on the host's status page for any recurrence.'
The second version gives the client a specific number, a specific cause, and a specific next step, all in three sentences. That is the level of detail a client report needs, no more and no less.
For a month with zero incidents, resist the temptation to pad the report with unrelated detail just to make it feel substantial. 'Uptime this period was 100%. No incidents to report.' is a complete, honest report on its own, and adding filler content around it does not make it more valuable.
Common Mistakes
Burying a real incident in vague language, hoping the client will not ask follow-up questions, tends to backfire once they do ask. Reporting only the uptime percentage without any incident detail leaves a client unable to judge whether a 99.5% month was one long outage or several short ones, which matters for how concerned they should be.
Sending the report late or inconsistently undermines the credibility of the number itself; a report that shows up on a different day every month reads as an afterthought rather than a real accountability practice. And never including a forward-looking note makes the report feel like a formality rather than active management of their site.
Writing a different report structure every month, rather than reusing a consistent template, makes it harder for a client to compare periods and makes the reporting process slower for you than it needs to be.
How MonitorMojo Helps
MonitorMojo's client-ready summaries turn a check result into something presentable without you needing to build a report layout from scratch. Check history holds the record of past checks for the reporting period, so pulling the uptime percentage and incident count for last month is a matter of reviewing saved results rather than reconstructing them from memory.
Because checks are on demand, pair a scheduled check routine (via the API or CLI) with a fixed monthly reporting date, so clients get their report on a predictable schedule rather than whenever someone remembers to compile it.
What this workflow means
Client Uptime SLA Report: What to Include is best understood as a repeatable website health workflow, not a promise that every outage or configuration issue will be avoided. A reusable client uptime report template, including what to include, how to describe an incident honestly, and a fill-in-the-blank layout for recurring reports.
In practice, this workflow centers on API, CLI, and AI-agent workflows that retrieve website health context with human review. Each check is planning input: it can show that the site is reachable, that a certificate has a given expiry window, that response time has shifted, or that a header is missing. It cannot prove root cause by itself or replace a human response. The value is in making the review consistent enough that site owners and small teams can spot issues before someone downstream has to ask about them.
Who should use this
This is most useful for site owners and small teams. Account managers who send recurring uptime reports to clients
Beyond that primary audience, the same checks are reusable by anyone with a public-facing URL that matters to revenue, leads, or reputation: a recurring review is cheap insurance compared to hearing about the problem from a client or customer first.
Step-by-step monitoring workflow
Start by listing the URLs that actually matter instead of just the homepage — for a small team doing a routine check before something breaks in front of a visitor, that usually means the pages tied to revenue, signups, or trust, not every page on the site.
Next, define the check types for each URL: reachability, HTTP status, HTTPS/SSL certificate status and expiry window, response time, redirect behavior, and security header presence. For API, CLI, and AI-agent workflows, document which endpoint or command runs the check and where the result is stored.
Set a cadence that matches the risk — a low-traffic page may only need a monthly look, while a page tied to revenue or signups deserves a check after every deployment and before any campaign or launch.
Record what you find with a consistent format: URL, check type, status, issue, owner, detected date, and next review date. Then say what actually happened in plain language — a check can surface a symptom, but site owners and small teams still need to confirm the cause.
- Choose the URLs that matter most to visitors, clients, revenue, and operations.
- Run uptime, SSL, response time, and security header checks on a consistent schedule.
- Triage failed or risky checks by likely owner: hosting, DNS, SSL, code, platform, or third party.
- Record notes in a repeatable format so future reviews do not start from scratch.
- Send a plain-language summary with the issue, impact, owner, and next review date.
- Run a confirmation check after remediation so there is an external result to reference.
Checklist or template
Use this template for recurring reviews: [URL], [Check Type], [Status], [Issue], [Priority], [Owner], [Detected Date], [Resolved Date], [Next Review Date]. Add a one-line summary at the top: what changed, what needs attention, and who owns the next step.
For site owners and small teams, group findings into the four signals that matter most: reachability, SSL status, response time, and security headers. Where nothing needs action, say the check found no issue in that area rather than implying full coverage.
- [URL]: the exact page or endpoint checked.
- [Check Type]: uptime, SSL, response time, headers, API, CLI, or agent workflow.
- [Status]: pass, review, failed, blocked, or needs human investigation.
- [Issue]: the observable symptom, not an unsupported root-cause claim.
- [Owner]: agency, developer, host, DNS provider, client, or third-party vendor.
- [Next Review Date]: when the team should confirm status again.
Common mistakes
The most common mistake is monitoring only the homepage while a checkout, signup, or booking flow silently breaks. Another is assuming SSL auto-renewal always works — it can fail quietly, and an external check is the only way to catch that before a browser warning does.
For site owners and small teams specifically, the recurring miss is treating one clean check as proof the whole site is fine, or fixing an issue without ever writing down what happened — which means the next person repeats the same investigation from zero.
- Tracking too many low-value URLs while missing the ones that matter.
- Skipping notes after an issue is resolved.
- Reporting a status without an owner or next step attached.
- Assuming automation can resolve an incident without human review.
- Treating one clean check as proof that every risk is covered.
Practical example
Consider a small team doing a routine check before something breaks in front of a visitor. A scheduled check flags that the site is slower than its usual baseline and that a security header is missing. Instead of guessing, the team logs the observation with a timestamp, assigns an owner, and re-checks after the fix ships — turning a vague "something feels off" into a specific, closed-loop task.
How MonitorMojo helps
MonitorMojo runs website health checks that combine reachability, SSL certificate status, response time, and security header presence in one workspace, so this workflow doesn't require stitching together several separate tools.
The API and CLI make the same checks scriptable for site owners and small teams who want them wired into an existing process, while credit-based checks keep it practical to run reviews exactly when they matter — before a client call, after a deploy, or when someone asks whether the site is healthy. Results still depend on hosting, DNS, and how quickly the responsible team acts on what the check finds.
Who this is for
- Account managers who send recurring uptime reports to clients
- Agencies formalizing an ad-hoc 'here's how your site did' email into a real template
- Freelancers who want a professional reporting cadence without building one from scratch
- Anyone who has had to explain an incident to a client and wants better language for it
Frequently Asked Questions
How often should I send a client uptime report?
Monthly is standard for most small-business clients. Higher-touch accounts, or clients recovering from a recent incident, may warrant weekly reporting until confidence is rebuilt.
Should I include every minor blip in the incident section?
No. Report incidents that meet your agreed threshold (for example, two consecutive failed checks). Including every transient blip creates noise and can make a genuinely healthy month look worse than it was.
Does MonitorMojo generate this client report automatically on a schedule?
MonitorMojo generates client-ready summaries from check results you run. Scheduling when those checks happen and when the report goes out is something you control via the API, CLI, or your own calendar, since MonitorMojo does not send reports on its own.
What if the incident was caused by the hosting provider, not us?
Say so plainly in the report. Clients generally respond better to an honest, specific explanation of an out-of-your-control cause than to vague language that could be read as evasive.
Does a clean uptime report guarantee the client relationship stays healthy?
No. A clear, consistent report builds trust over time, but it does not substitute for actually resolving incidents quickly or guarantee a client will renew regardless of other factors.
Can this prevent every issue with the site?
No. Monitoring helps site owners and small teams detect website health signals and organize follow-up, but it does not prevent every outage, SSL issue, slow response, or third-party failure. The result still depends on hosting, DNS, infrastructure, and how quickly the responsible team investigates and responds.