MonitorMojo Blog
Uptime SLA Monitoring for Client Websites
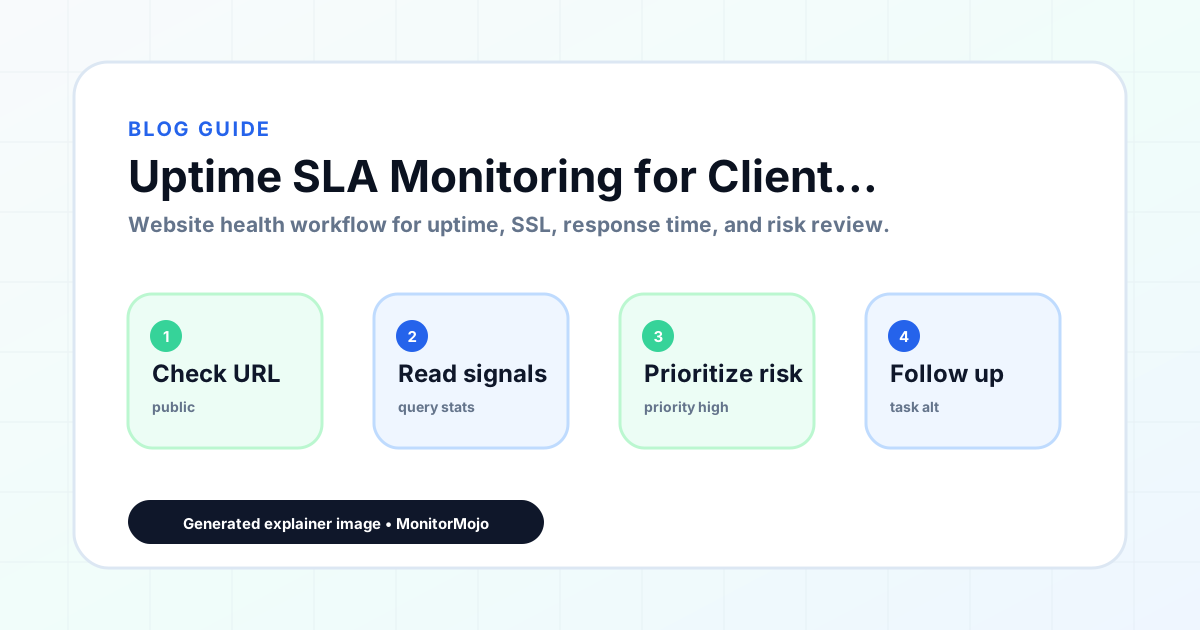
Once an SLA commits to an uptime standard, someone has to actually track whether you are meeting it, not just assume you are. This is the practical side of uptime SLA monitoring: how to record uptime percentage, how to count incidents fairly, and how to calculate mean time to resolution (MTTR) in a way that holds up if a client ever asks to see the math. This expanded guide explains the practical monitoring workflow behind the topic, who should use it, what to check, how to document findings, and how to turn website health signals into useful client, developer, API, CLI, or AI-agent workflows without overstating what monitoring can prove.
The Numbers That Actually Matter for an Uptime SLA
Uptime percentage is the headline number, but it is easy to calculate wrong. It should be (total time minus downtime) divided by total time, over the SLA's stated period, not an all-time average that dilutes a bad month into an impressive-looking year. Incident count matters alongside the percentage, since a site with one long outage and a site with ten short ones can post similar uptime percentages while representing very different operational realities.
MTTR (mean time to resolution) measures how long it takes to fix things once they break, and it is often the more actionable number of the three, since it points directly at your response process rather than at hosting reliability you may not control.
Decide which of these three numbers actually appear in the SLA itself versus which are tracked only for internal purposes. Most client-facing SLAs reference uptime percentage and a response-time commitment; MTTR is usually more useful as an internal quality metric than as a contractual promise, since it depends on factors outside either party's full control.
- Uptime percentage over the SLA period
- Number of distinct incidents
- Mean time to resolution (MTTR)
- Longest single incident duration
Recording Downtime Fairly
Decide upfront what counts as downtime versus a blip. A single failed check that recovers on the very next check might be a transient network hiccup, not a real outage; requiring two consecutive failed checks before counting it as downtime avoids inflating the incident count with noise.
Also decide how to handle excluded time, like a planned maintenance window the client agreed to, so it does not count against the uptime percentage you report. Write this rule down once so it does not become a debate every time a report goes out.
A Worked Calculation
Consider a 30-day reporting period (43,200 minutes total). Two confirmed incidents occurred: one lasting 25 minutes, one lasting 8 minutes, for 33 total minutes of downtime. Uptime percentage is (43,200 minus 33) divided by 43,200, which comes out to roughly 99.92%.
For MTTR, average the resolution time of the two incidents: if the 25-minute incident took 40 minutes total from detection to full resolution, and the 8-minute incident took 15 minutes total, the average resolution time across both is about 27.5 minutes. Notice that MTTR (which includes investigation and confirmation time after the site came back) is often longer than the raw downtime minutes themselves, since 'resolved' means confirmed stable, not just technically reachable again.
Walking through a calculation like this once, with real numbers, makes the difference between uptime percentage and MTTR concrete in a way that definitions alone do not.
A Practical Tracking Cadence
Since MonitorMojo runs checks on demand rather than continuously, uptime SLA tracking works best as a scheduled routine you control: run reachability checks at a fixed interval through the API or CLI, log each result with a timestamp, and calculate the period's uptime percentage from that log at reporting time.
A tighter check interval gives a more precise uptime percentage but costs more checks; a looser interval is cheaper but may miss a short outage entirely. Match the interval to what the SLA actually promises, rather than defaulting to either extreme.
As a rough guide, a check every 5 minutes catches outages down to roughly that granularity and is appropriate for a revenue-critical SLA. A check every hour is a reasonable middle ground for most standard-tier client sites. A check once or twice daily is enough for a low-stakes brochure site where the SLA itself only promises a basic check-in, not fine-grained outage detection.
Building a Simple Uptime Log
A workable uptime log does not need a database or a dashboard product to start. A spreadsheet or a plain-text log with one row per check (timestamp, site, result, response code, response time) is enough to calculate every metric this guide covers, and it is far more transparent to a skeptical client than a black-box percentage with no underlying data.
Keep the raw log even after you calculate a period's summary numbers. If a client ever disputes a number, being able to show the individual check timestamps that produced it is a much stronger position than asserting the percentage without backup.
For agencies tracking several client sites, one shared log format (rather than a different spreadsheet per client) makes it much easier to build a consistent reporting process and to spot which accounts need attention at a glance.
Common Mistakes
Calculating uptime as an all-time average, so one bad week three months ago quietly boosts this month's number, misrepresents current performance. Not defining what counts as an 'incident' before a dispute happens leads to arguments about whether a five-minute blip should count the same as a two-hour outage.
Checking too infrequently to actually catch short outages, then reporting a suspiciously perfect uptime percentage, undermines credibility once a client notices an outage that never showed up in the report. And tracking uptime without also tracking MTTR misses the fact that two sites with identical uptime percentages can have very different incident response quality.
Discarding the raw check log once a summary percentage is calculated leaves nothing to point to if a client questions the number later; keeping the underlying data is what makes the summary defensible.
How MonitorMojo Helps
Each MonitorMojo check returns a clear reachability result you can log as a data point in your own uptime tracking. Because checks are on demand, you control the check interval directly through the API or CLI, so you can match the interval to what your SLA promises rather than being locked into a fixed monitoring frequency.
Check history preserves the record of past checks, giving you the raw log needed to calculate uptime percentage, incident count, and MTTR for any reporting period. Credit-based pricing means a tighter check interval for a high-value SLA client costs proportionally more, rather than requiring a separate subscription tier.
What this workflow means
Uptime SLA Monitoring for Client Websites is best understood as a repeatable website health workflow, not a promise that every outage or configuration issue will be avoided. How to calculate uptime percentage correctly, define downtime fairly, and track uptime SLA compliance with a check routine you control.
In practice, this workflow centers on API, CLI, and AI-agent workflows that retrieve website health context with human review. Each check is planning input: it can show that the site is reachable, that a certificate has a given expiry window, that response time has shifted, or that a header is missing. It cannot prove root cause by itself or replace a human response. The value is in making the review consistent enough that site owners and small teams can spot issues before someone downstream has to ask about them.
Who should use this
This is most useful for site owners and small teams. Agencies that need to prove uptime SLA compliance with real numbers
Beyond that primary audience, the same checks are reusable by anyone with a public-facing URL that matters to revenue, leads, or reputation: a recurring review is cheap insurance compared to hearing about the problem from a client or customer first.
Step-by-step monitoring workflow
Start by listing the URLs that actually matter instead of just the homepage — for a small team doing a routine check before something breaks in front of a visitor, that usually means the pages tied to revenue, signups, or trust, not every page on the site.
Next, define the check types for each URL: reachability, HTTP status, HTTPS/SSL certificate status and expiry window, response time, redirect behavior, and security header presence. For API, CLI, and AI-agent workflows, document which endpoint or command runs the check and where the result is stored.
Set a cadence that matches the risk — a low-traffic page may only need a monthly look, while a page tied to revenue or signups deserves a check after every deployment and before any campaign or launch.
Record what you find with a consistent format: URL, check type, status, issue, owner, detected date, and next review date. Then say what actually happened in plain language — a check can surface a symptom, but site owners and small teams still need to confirm the cause.
- Choose the URLs that matter most to visitors, clients, revenue, and operations.
- Run uptime, SSL, response time, and security header checks on a consistent schedule.
- Triage failed or risky checks by likely owner: hosting, DNS, SSL, code, platform, or third party.
- Record notes in a repeatable format so future reviews do not start from scratch.
- Send a plain-language summary with the issue, impact, owner, and next review date.
- Run a confirmation check after remediation so there is an external result to reference.
Checklist or template
Use this template for recurring reviews: [URL], [Check Type], [Status], [Issue], [Priority], [Owner], [Detected Date], [Resolved Date], [Next Review Date]. Add a one-line summary at the top: what changed, what needs attention, and who owns the next step.
For site owners and small teams, group findings into the four signals that matter most: reachability, SSL status, response time, and security headers. Where nothing needs action, say the check found no issue in that area rather than implying full coverage.
- [URL]: the exact page or endpoint checked.
- [Check Type]: uptime, SSL, response time, headers, API, CLI, or agent workflow.
- [Status]: pass, review, failed, blocked, or needs human investigation.
- [Issue]: the observable symptom, not an unsupported root-cause claim.
- [Owner]: agency, developer, host, DNS provider, client, or third-party vendor.
- [Next Review Date]: when the team should confirm status again.
Common mistakes
The most common mistake is monitoring only the homepage while a checkout, signup, or booking flow silently breaks. Another is assuming SSL auto-renewal always works — it can fail quietly, and an external check is the only way to catch that before a browser warning does.
For site owners and small teams specifically, the recurring miss is treating one clean check as proof the whole site is fine, or fixing an issue without ever writing down what happened — which means the next person repeats the same investigation from zero.
- Tracking too many low-value URLs while missing the ones that matter.
- Skipping notes after an issue is resolved.
- Reporting a status without an owner or next step attached.
- Assuming automation can resolve an incident without human review.
- Treating one clean check as proof that every risk is covered.
Practical example
Consider a small team doing a routine check before something breaks in front of a visitor. A scheduled check flags that the site is slower than its usual baseline and that a security header is missing. Instead of guessing, the team logs the observation with a timestamp, assigns an owner, and re-checks after the fix ships — turning a vague "something feels off" into a specific, closed-loop task.
How MonitorMojo helps
MonitorMojo runs website health checks that combine reachability, SSL certificate status, response time, and security header presence in one workspace, so this workflow doesn't require stitching together several separate tools.
The API and CLI make the same checks scriptable for site owners and small teams who want them wired into an existing process, while credit-based checks keep it practical to run reviews exactly when they matter — before a client call, after a deploy, or when someone asks whether the site is healthy. Results still depend on hosting, DNS, and how quickly the responsible team acts on what the check finds.
Who this is for
- Agencies that need to prove uptime SLA compliance with real numbers
- Account managers calculating uptime percentage and MTTR for client reports
- Developers building their own uptime-logging script against the API or CLI
- Anyone who has had a client dispute an uptime claim without supporting data
Frequently Asked Questions
How do you calculate uptime percentage correctly?
Total time minus downtime, divided by total time, calculated over the specific SLA reporting period, not as an all-time average.
What counts as downtime versus a false alarm?
A common rule is to require two consecutive failed checks before counting it as real downtime, since a single failed check can be a transient network blip rather than an actual outage.
Does MonitorMojo track uptime percentage automatically?
MonitorMojo runs checks on demand and saves results to check history. Calculating an uptime percentage from those results, on whatever schedule you check at, is something you build using the API or CLI rather than an automatic continuous metric.
Why track MTTR in addition to uptime percentage?
Two sites can post the same uptime percentage while having very different incident response quality. MTTR shows how quickly incidents get resolved once they start, which uptime percentage alone does not reveal.
Does a high uptime percentage guarantee client satisfaction?
No. A technically strong uptime number does not account for slow response times, missing security headers, or how well incidents were communicated, all of which affect how a client experiences reliability.
Can this prevent every issue with the site?
No. Monitoring helps site owners and small teams detect website health signals and organize follow-up, but it does not prevent every outage, SSL issue, slow response, or third-party failure. The result still depends on hosting, DNS, infrastructure, and how quickly the responsible team investigates and responds.