MonitorMojo Blog
Website Health KPIs for Client Reports
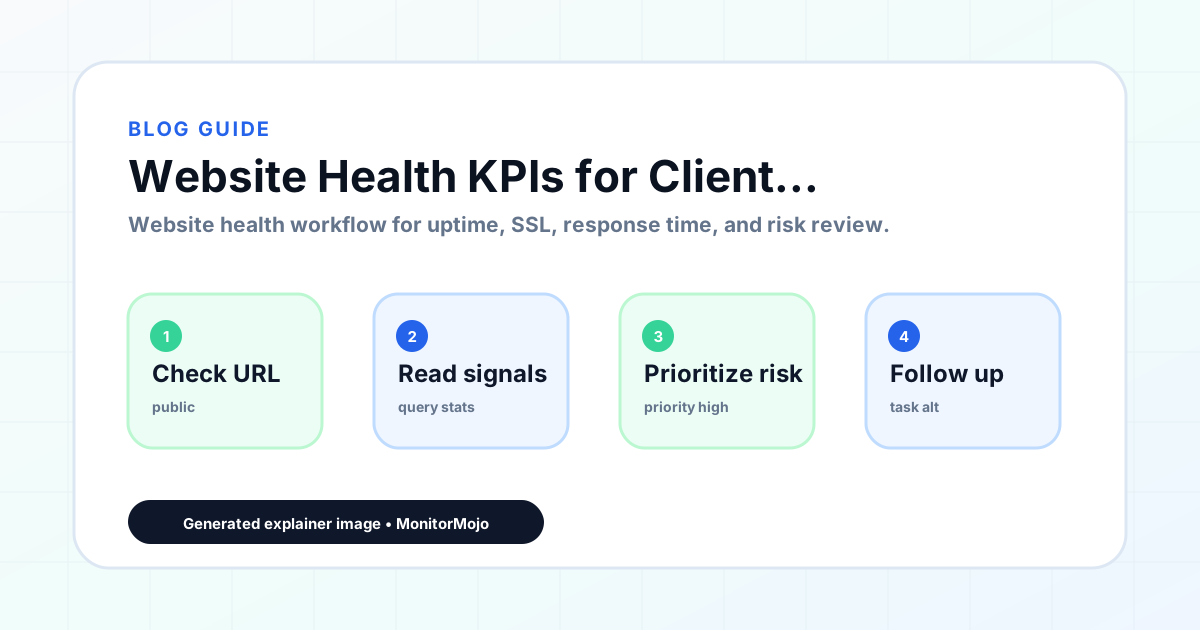
The metrics that matter for your own internal operations are rarely the right ones to hand a client. This guide is specifically about the small set of numbers worth putting in front of a non-technical client: enough to show real value and real transparency, without burying them in MTTR calculations or certificate chain details they have no reason to parse. This expanded guide explains the practical monitoring workflow behind the topic, who should use it, what to check, how to document findings, and how to turn website health signals into useful client, developer, API, CLI, or AI-agent workflows without overstating what monitoring can prove.
What Clients Actually Want to Know
Strip it down to three questions a client actually cares about: was my site up, was it fast enough, and is anything at risk right now. Every metric in a client report should map to one of those three questions; anything that does not is probably an internal metric that snuck into the wrong document.
Clients generally do not need incident-level technical detail (error codes, stack traces, DNS TTLs). They need enough plain-language context to understand what happened and enough confidence that it is being watched, without needing a glossary.
It helps to imagine the report being forwarded to someone even less technical than the client themselves, such as a business partner or a board member. A report that still makes sense in that scenario, without needing the client to translate it further, is calibrated at about the right level of detail.
The Client-Facing Metric Set
A workable client report needs surprisingly few numbers. Uptime percentage for the period answers 'was my site up.' A plain-language response-time note (faster, slower, or about the same as last period) answers 'was it fast enough,' without necessarily citing raw milliseconds. SSL status (valid, and days until next renewal) and a one-line security header status answer 'is anything at risk right now.'
Resist adding a sixth or seventh metric just because a tool happens to make it available. Every additional number in a client report adds a small amount of cognitive load, and the marginal value of a sixth metric rarely justifies that cost for a non-technical reader.
- Uptime percentage for the period
- Response time trend (faster / slower / stable vs. last period)
- SSL certificate status and days until renewal
- Security header status (in place / needs attention)
- Incident count with a one-line plain-language summary each
A Short Worked Example Report
A minimal but complete monthly note might read: 'Uptime this month: 99.98%. Speed: about the same as last month. Certificate: valid, renews automatically in 62 days. Security headers: all in place. One brief outage on the 9th (6 minutes, hosting provider issue, resolved automatically). Nothing needs your attention this month.'
Notice what is absent: no error codes, no MTTR figure, no mention of which specific header was checked. Everything present maps directly to one of the three questions a client actually asks, and the whole thing reads in under fifteen seconds.
Presenting the Metrics Without Overselling Them
Avoid absolute language like 'guaranteed secure' or 'fully protected' next to these metrics; a passing header check or valid certificate is a positive signal, not proof against every possible issue. Framing metrics honestly (this checks four common health signals; it does not replace a full security audit or guarantee uptime) protects both your credibility and the client's expectations.
Where a metric is neutral or slightly negative, present it plainly rather than burying it in vague language. A client who reads 'response time was 15% slower this month, and here's what we're looking into' trusts the report more than one who later discovers a problem was minimized.
A simple habit that reinforces honest framing is to include one sentence, once per report or once in an onboarding conversation, explaining exactly what is and is not being checked. This costs almost nothing to include and meaningfully reduces the odds a client assumes broader coverage than is actually being provided.
Adjusting the Metric Set for Different Kinds of Clients
Not every client needs the same depth. A client running a simple brochure site is usually satisfied with a short quarterly note: uptime was fine, certificate is valid, nothing to report. A client running an ecommerce store or a lead-generation site with real revenue on the line usually wants the full metric set on a monthly basis, since a slow checkout or a security warning has a direct financial impact for them.
Let the client's own stake in the site's performance guide how much detail to include, rather than sending the same template to every account regardless of size or risk. A too-detailed report to a low-stakes client can come across as padding to justify a fee; a too-thin report to a high-stakes client can come across as not paying enough attention.
When in doubt, ask the client directly what they want to see. Some non-technical clients genuinely want more detail than the default template provides, and asking once at the start of the relationship avoids guessing wrong for months.
Common Mistakes
Including internal operational metrics like MTTR or check frequency in a client report adds noise a client cannot act on and rarely wants. Overselling a green checkmark as a guarantee of security or uptime sets an expectation that will eventually be violated by an event outside your control, and that violation lands harder because of the earlier overclaim.
Sending a wall of raw numbers without a one-line plain-language interpretation next to each one forces the client to do the translation work themselves, which most will not do, so the report goes unread.
Using the exact same report depth and cadence for every client regardless of the site's stakes wastes effort on low-risk accounts while potentially under-serving the ones where a health issue would actually cost the client money.
How MonitorMojo Helps
MonitorMojo's client-ready summaries are built for exactly this audience mismatch problem: they translate a check's reachability, SSL, response time, and header results into a format a non-technical client can read without a glossary. Check history supplies the period-over-period comparison (faster, slower, stable) that makes a single response-time number meaningful.
Because checks are on demand, you decide how often to run them and how current the client-facing numbers are, via the dashboard, API, or CLI, rather than being locked into a fixed reporting interval.
What this workflow means
Website Health KPIs for Client Reports is best understood as a repeatable website health workflow, not a promise that every outage or configuration issue will be avoided. The small set of website health metrics worth showing a non-technical client, and how to present them honestly without overselling what a passing check means.
In practice, this workflow centers on API, CLI, and AI-agent workflows that retrieve website health context with human review. Each check is planning input: it can show that the site is reachable, that a certificate has a given expiry window, that response time has shifted, or that a header is missing. It cannot prove root cause by itself or replace a human response. The value is in making the review consistent enough that site owners and small teams can spot issues before someone downstream has to ask about them.
Who should use this
This is most useful for site owners and small teams. Agencies building client-facing reports distinct from internal monitoring dashboards
Beyond that primary audience, the same checks are reusable by anyone with a public-facing URL that matters to revenue, leads, or reputation: a recurring review is cheap insurance compared to hearing about the problem from a client or customer first.
Step-by-step monitoring workflow
Start by listing the URLs that actually matter instead of just the homepage — for a small team doing a routine check before something breaks in front of a visitor, that usually means the pages tied to revenue, signups, or trust, not every page on the site.
Next, define the check types for each URL: reachability, HTTP status, HTTPS/SSL certificate status and expiry window, response time, redirect behavior, and security header presence. For API, CLI, and AI-agent workflows, document which endpoint or command runs the check and where the result is stored.
Set a cadence that matches the risk — a low-traffic page may only need a monthly look, while a page tied to revenue or signups deserves a check after every deployment and before any campaign or launch.
Record what you find with a consistent format: URL, check type, status, issue, owner, detected date, and next review date. Then say what actually happened in plain language — a check can surface a symptom, but site owners and small teams still need to confirm the cause.
- Choose the URLs that matter most to visitors, clients, revenue, and operations.
- Run uptime, SSL, response time, and security header checks on a consistent schedule.
- Triage failed or risky checks by likely owner: hosting, DNS, SSL, code, platform, or third party.
- Record notes in a repeatable format so future reviews do not start from scratch.
- Send a plain-language summary with the issue, impact, owner, and next review date.
- Run a confirmation check after remediation so there is an external result to reference.
Checklist or template
Use this template for recurring reviews: [URL], [Check Type], [Status], [Issue], [Priority], [Owner], [Detected Date], [Resolved Date], [Next Review Date]. Add a one-line summary at the top: what changed, what needs attention, and who owns the next step.
For site owners and small teams, group findings into the four signals that matter most: reachability, SSL status, response time, and security headers. Where nothing needs action, say the check found no issue in that area rather than implying full coverage.
- [URL]: the exact page or endpoint checked.
- [Check Type]: uptime, SSL, response time, headers, API, CLI, or agent workflow.
- [Status]: pass, review, failed, blocked, or needs human investigation.
- [Issue]: the observable symptom, not an unsupported root-cause claim.
- [Owner]: agency, developer, host, DNS provider, client, or third-party vendor.
- [Next Review Date]: when the team should confirm status again.
Common mistakes
The most common mistake is monitoring only the homepage while a checkout, signup, or booking flow silently breaks. Another is assuming SSL auto-renewal always works — it can fail quietly, and an external check is the only way to catch that before a browser warning does.
For site owners and small teams specifically, the recurring miss is treating one clean check as proof the whole site is fine, or fixing an issue without ever writing down what happened — which means the next person repeats the same investigation from zero.
- Tracking too many low-value URLs while missing the ones that matter.
- Skipping notes after an issue is resolved.
- Reporting a status without an owner or next step attached.
- Assuming automation can resolve an incident without human review.
- Treating one clean check as proof that every risk is covered.
Practical example
Consider a small team doing a routine check before something breaks in front of a visitor. A scheduled check flags that the site is slower than its usual baseline and that a security header is missing. Instead of guessing, the team logs the observation with a timestamp, assigns an owner, and re-checks after the fix ships — turning a vague "something feels off" into a specific, closed-loop task.
How MonitorMojo helps
MonitorMojo runs website health checks that combine reachability, SSL certificate status, response time, and security header presence in one workspace, so this workflow doesn't require stitching together several separate tools.
The API and CLI make the same checks scriptable for site owners and small teams who want them wired into an existing process, while credit-based checks keep it practical to run reviews exactly when they matter — before a client call, after a deploy, or when someone asks whether the site is healthy. Results still depend on hosting, DNS, and how quickly the responsible team acts on what the check finds.
Who this is for
- Agencies building client-facing reports distinct from internal monitoring dashboards
- Account managers who need to translate technical check results into plain language
- Freelancers who want a simple, honest metric set for monthly client updates
- Anyone who has accidentally sent a client an internal-ops-heavy report by mistake
Frequently Asked Questions
What is the minimum metric set worth including in a client report?
Uptime percentage, a response-time trend note, SSL certificate status, security header status, and incident count with a one-line summary each. That covers the three questions clients actually ask: was it up, was it fast, is anything at risk.
Should MTTR or check frequency go in a client report?
No. Those are internal operational metrics. They belong in your own review process, not in a client-facing document where they add noise without helping the client's decision-making.
Is it okay to say a client's site is 'fully secure' if the checks pass?
No. A passing check on reachability, SSL, and headers is a positive signal, not a guarantee against every security issue. Framing it as a guarantee sets an expectation that will eventually be broken by something outside the check's scope.
Does MonitorMojo build this client report automatically?
MonitorMojo generates client-ready summaries from your check results, which map well to this metric set. You decide when to run the checks and send the report, since MonitorMojo does not send reports on a schedule itself.
How do I explain a negative metric to a client without it sounding alarming?
State it plainly alongside what you are doing about it: for example, response time was slower this period, and here is what is being investigated. Vague or minimized language tends to damage trust more than a direct, specific explanation.
Can this prevent every issue with the site?
No. Monitoring helps site owners and small teams detect website health signals and organize follow-up, but it does not prevent every outage, SSL issue, slow response, or third-party failure. The result still depends on hosting, DNS, infrastructure, and how quickly the responsible team investigates and responds.