MonitorMojo Blog
Website Monitoring Operating System for Agencies
A monitoring operating system is the combination of people, processes, and tools that runs your agency's monitoring service on a consistent, scalable basis. It is not a single tool or a single workflow — it is the entire system that takes a new client from initial setup to ongoing monitoring to monthly reporting to eventual offboarding, with consistent quality at every step. This expanded guide explains the practical monitoring workflow behind the topic, who should use it, what to check, how to document findings, and how to turn website health signals into useful client, developer, API, CLI, or AI-agent workflows without overstating what monitoring can prove.
What a Monitoring Operating System Means
The term "operating system" is borrowed from business operations, not software. A business operating system is the structured set of processes, meetings, metrics, and accountabilities that makes an organization run predictably. A monitoring operating system applies that same concept to the monitoring service specifically.
At its core, a monitoring operating system has three components: the people who run it (who is responsible for what), the processes they follow (documented workflows and SOPs), and the tools they use (the monitoring platform, the reporting templates, the communication channels).
When all three components are well-defined and working together, the monitoring service runs consistently regardless of which team member is working on it, which client is being served, or how many clients are in the portfolio. That consistency is what makes a monitoring operating system valuable.
The Three Layers of a Monitoring Operating System
Layer 1: Data. The monitoring tool provides the raw health check data — uptime status, SSL findings, response time, security headers, risk signals. This data is the foundation. Without reliable, consistent data, nothing else works. The data layer needs to be comprehensive (covering all five health categories), consistent (the same methodology for every client), and historical (stored so trends can be tracked over time).
Layer 2: Process. The workflows that take raw data and turn it into client value — the check workflow (how checks get run), the review process (how results get evaluated), the reporting workflow (how findings become client reports), and the alert process (how critical findings get escalated). Process documentation is what makes the system teachable and delegatable.
Layer 3: Communication. How findings reach clients, how clients respond to action items, how the monitoring relationship stays visible and valued. The monthly report is the primary communication layer. Immediate alerts for critical findings are the secondary layer. Quarterly strategy calls (for premium clients) are the relationship layer.
Building Your Monitoring Operating System
Start with the data layer. Choose a monitoring tool that covers all five health categories consistently. Set up check configurations for all current clients. Confirm that historical data is being stored and is accessible for comparison.
Then build the process layer. Document the check workflow. Document the results review process. Build your report template. Document the alert handling procedure. These documents together form your monitoring SOP — the heart of the process layer.
Then build the communication layer. Decide how reports are delivered and on what schedule. Set up the alert communication path (who gets notified, on what channel, within what timeframe). For premium clients, schedule the quarterly strategy calls and decide what is covered in them.
Operating System Metrics: What to Track
A monitoring operating system should have its own performance metrics. Key metrics to track: what percentage of clients had checks run on schedule this month, what percentage of critical findings were communicated within 24 hours, what percentage of reports were delivered on time, and how many open action items are currently outstanding across all clients.
These metrics tell you whether the operating system is working. If checks are running late for 30% of clients, the scheduling process needs attention. If reports are consistently delivered late, the reporting workflow needs to be streamlined. Metrics reveal the gaps that are invisible when you are just executing the process day to day.
How MonitorMojo Helps
MonitorMojo serves as the data layer of your monitoring operating system. Consistent, comprehensive health checks across uptime, SSL, response time, security headers, and risk signals give you the reliable data foundation that the rest of the system depends on.
The API enables integration between the data layer and the process layer — check results can be fed automatically into your reporting workflow, comparison data can be pulled for review without manual lookup, and alert thresholds can trigger automated notifications.
Credit-based pricing makes the cost of the data layer predictable and scalable. As your operating system grows — more clients, more checks — the data layer cost scales linearly and predictably, rather than accelerating faster than your revenue.
What this workflow means
Website Monitoring Operating System for Agencies is best understood as a repeatable website health workflow, not a promise that every outage or configuration issue will be avoided. Build a website monitoring operating system for your agency — the people, processes, and tools that keep client websites healthy at scale.
In practice, this workflow centers on uptime, SSL certificates, response time, security headers, website health summaries, and monthly review notes. Each check is planning input: it can show that a client's site is reachable, that a certificate has a given expiry window, that response time has shifted, or that a header is missing. It cannot prove root cause by itself or replace a human response. The value is in making the review consistent enough that web agencies and client-services teams can spot issues before someone downstream has to ask about them.
Who should use this
This is most useful for web agencies and client-services teams. Agency operators building a monitoring service that can run consistently at scale
Beyond that primary audience, the same checks are reusable by anyone with a public-facing URL that matters to revenue, leads, or reputation: a recurring review is cheap insurance compared to hearing about the problem from a client or customer first.
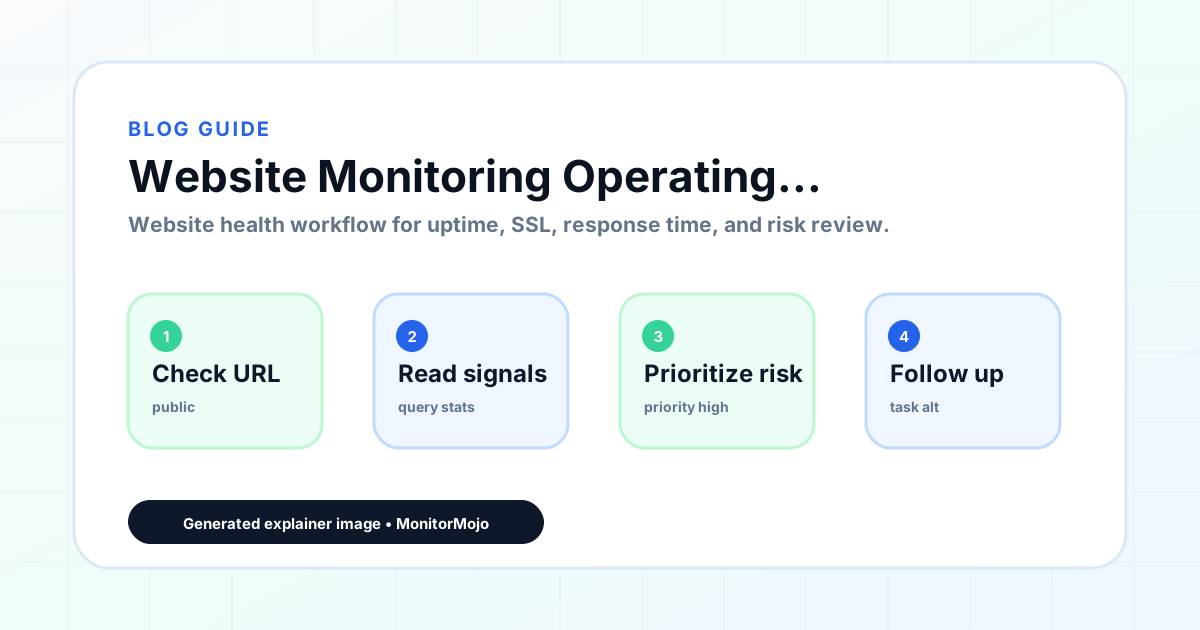
Step-by-step monitoring workflow
Start by listing the URLs that actually matter instead of just the homepage — for an agency reviewing a portfolio of client sites before a monthly report, that usually means the pages tied to revenue, signups, or trust, not every page on the site.
Next, define the check types for each URL: reachability, HTTP status, HTTPS/SSL certificate status and expiry window, response time, redirect behavior, and security header presence. For API, CLI, and AI-agent workflows, document which endpoint or command runs the check and where the result is stored.
Set a cadence that matches the risk — a low-traffic page may only need a monthly look, while a page tied to revenue or signups deserves a check after every deployment and before any campaign or launch.
Record what you find with a consistent format: URL, check type, status, issue, owner, detected date, and next review date. Then say what actually happened in plain language — a check can surface a symptom, but web agencies and client-services teams still need to confirm the cause.
- Choose the URLs that matter most to visitors, clients, revenue, and operations.
- Run uptime, SSL, response time, and security header checks on a consistent schedule.
- Triage failed or risky checks by likely owner: hosting, DNS, SSL, code, platform, or third party.
- Record notes in a repeatable format so future reviews do not start from scratch.
- Send a plain-language summary with the issue, impact, owner, and next review date.
- Run a confirmation check after remediation so there is an external result to reference.
Checklist or template
Use this template for recurring reviews: [URL], [Check Type], [Status], [Issue], [Priority], [Owner], [Detected Date], [Resolved Date], [Next Review Date]. Add a one-line summary at the top: what changed, what needs attention, and who owns the next step.
For web agencies and client-services teams, group findings into the four signals that matter most: reachability, SSL status, response time, and security headers. Where nothing needs action, say the check found no issue in that area rather than implying full coverage.
- [URL]: the exact page or endpoint checked.
- [Check Type]: uptime, SSL, response time, headers, API, CLI, or agent workflow.
- [Status]: pass, review, failed, blocked, or needs human investigation.
- [Issue]: the observable symptom, not an unsupported root-cause claim.
- [Owner]: agency, developer, host, DNS provider, client, or third-party vendor.
- [Next Review Date]: when the team should confirm status again.
Common mistakes
The most common mistake is monitoring only the homepage while a checkout, signup, or booking flow silently breaks. Another is assuming SSL auto-renewal always works — it can fail quietly, and an external check is the only way to catch that before a browser warning does.
For web agencies and client-services teams specifically, the recurring miss is treating one clean check as proof the whole site is fine, or fixing an issue without ever writing down what happened — which means the next person repeats the same investigation from zero.
- Tracking too many low-value URLs while missing the ones that matter.
- Skipping notes after an issue is resolved.
- Reporting a status without an owner or next step attached.
- Assuming automation can resolve an incident without human review.
- Treating one clean check as proof that every risk is covered.
Practical example
Consider an agency reviewing a portfolio of client sites before a monthly report. A scheduled check flags that a client's site is slower than its usual baseline and that a security header is missing. Instead of guessing, the team logs the observation with a timestamp, assigns an owner, and re-checks after the fix ships — turning a vague "something feels off" into a specific, closed-loop task.
How MonitorMojo helps
MonitorMojo runs website health checks that combine reachability, SSL certificate status, response time, and security header presence in one workspace, so this workflow doesn't require stitching together several separate tools.
The API and CLI make the same checks scriptable for web agencies and client-services teams who want them wired into an existing process, while credit-based checks keep it practical to run reviews exactly when they matter — before a client call, after a deploy, or when someone asks whether a client's site is healthy. Results still depend on hosting, DNS, and how quickly the responsible team acts on what the check finds.
Who this is for
- Agency operators building a monitoring service that can run consistently at scale
- Freelancers who want to turn ad-hoc monitoring into a structured, profitable service
- Web professionals building a monitoring practice that can eventually be delegated or sold
- Anyone who wants their monitoring service to be a system rather than a set of personal habits
Frequently Asked Questions
How long does it take to build a monitoring operating system?
The foundation — a documented check workflow, a report template, an alert process — can be built in a few days. Refining and improving it happens over months as you encounter edge cases and learn what works. Most agencies have a solid monitoring operating system within three to six months of intentional process building.
Do I need specialized software for the operating system?
No. The monitoring tool (MonitorMojo), a report template (Google Doc, Notion, or similar), a client record system (spreadsheet or CRM), and a communication platform (email) are sufficient to build a complete monitoring operating system. Specialized software becomes valuable when the volume of clients makes manual process management too slow.
How do I know if my monitoring operating system is working well?
Measure it. Track check schedule adherence, report delivery timeliness, critical finding communication speed, and open action item count. If these metrics are consistently within your targets, the system is working. If they are not, investigate where the process is breaking down.
Should I build the operating system before or after I have clients?
Before is ideal — having a system ready when the first monitoring clients come on makes the service professional from day one. In practice, most agencies build the system incrementally as they add clients. The key is building it intentionally rather than letting it grow organically as a collection of ad-hoc habits.
Can this prevent every issue with a client's site?
No. Monitoring helps web agencies and client-services teams detect website health signals and organize follow-up, but it does not prevent every outage, SSL issue, slow response, or third-party failure. The result still depends on hosting, DNS, infrastructure, and how quickly the responsible team investigates and responds.
What should a monitoring report include?
The URL, check type, current status, detected issue, priority, owner, detected date, resolved date if applicable, and the next review date. Keep the language tied to what the check actually observed, especially when the root cause still needs developer, host, or platform review.