MonitorMojo Blog
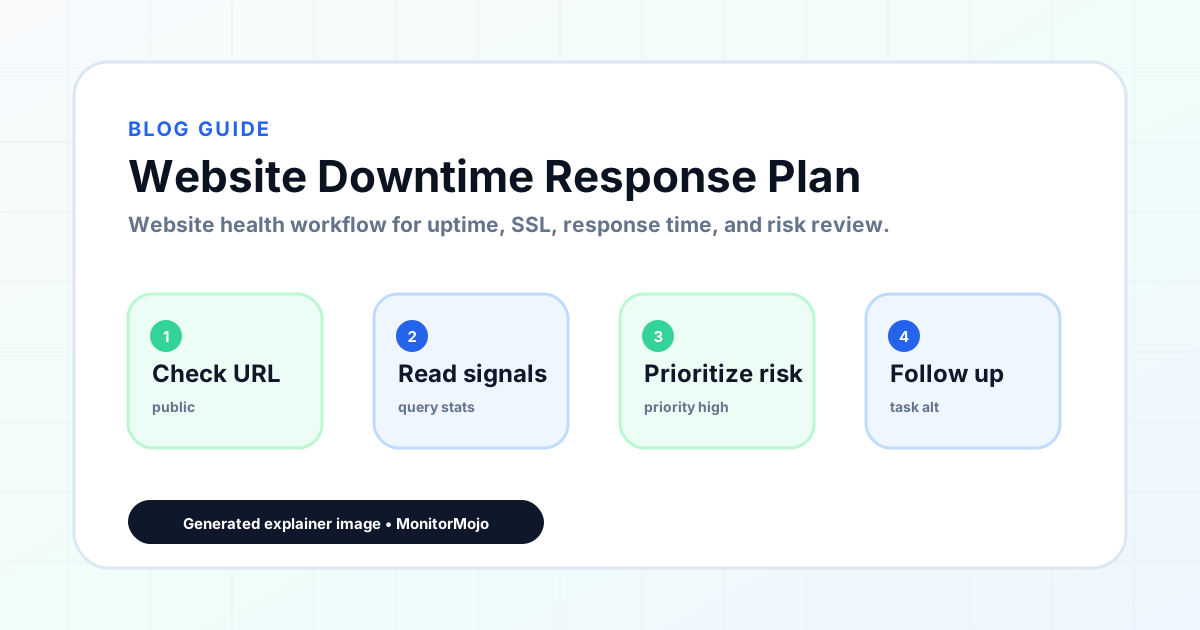
Website Downtime Response Plan
This playbook covers one specific failure mode: the site is unreachable. Not slow, not missing a header, not a bad certificate, just down. Downtime has its own diagnostic order (DNS, host, application, then everything else), and treating it as a distinct playbook rather than folding it into a generic incident plan saves time in the exact moment when time is scarcest. This expanded guide explains the practical monitoring workflow behind the topic, who should use it, what to check, how to document findings, and how to turn website health signals into useful client, developer, API, CLI, or AI-agent workflows without overstating what monitoring can prove.
Confirming the Site Is Actually Down
Before anything else, rule out a false alarm. Check from a different network or device, since a local ISP or DNS resolver issue can make a perfectly healthy site look down to just you. Run an on-demand check to get a clean, independent read on reachability, response code, and response time in one shot.
If the site is confirmed unreachable, note the exact response: is it timing out with no response at all, or returning an error status code? A timeout usually points toward DNS, networking, or the server being completely unresponsive. An error status code (500s especially) points toward the application or a downstream dependency.
Write down the exact time you first confirmed the outage, even before you know the cause. This single timestamp becomes the anchor for every other measurement in the incident: how long it took to diagnose, how long to fix, and eventually, the MTTR figure for whatever report or postmortem follows.
Diagnostic Order: Where to Look First
Work outside-in. Start with DNS, since a bad DNS change is one of the most common and most confusing causes of sudden downtime, it looks like the server vanished when actually the name never resolved correctly. Next check the hosting platform's own status page, since a provider-wide incident means the fix is not yours to make, only to communicate.
If DNS and the host both check out, look at the application layer: a bad deploy, a crashed process, a full disk, or an exhausted connection pool are the usual suspects. Check the deploy history first; a downtime incident that starts right after a deploy is a deploy problem until proven otherwise.
Working through this list in order, rather than jumping to whichever layer feels most familiar, is what keeps diagnosis fast even under pressure. Each layer takes only a minute or two to rule out, and skipping ahead usually costs more time than it saves when the actual cause turns out to be earlier in the list.
- DNS resolution and domain configuration
- Hosting provider status and infrastructure
- Recent deploys or configuration changes
- Application errors, crashed processes, or resource exhaustion
- Downstream dependencies (database, third-party APIs, CDN)
When Downtime Only Affects Part of the Site
Partial downtime is a different diagnostic path than a full outage. If the homepage loads but the checkout or login flow does not, the cause is more likely a specific backend service, an API integration, or a database issue affecting that one flow, rather than the DNS or hosting-level problems that usually cause a full outage.
Check whether the issue is regional before assuming it is a code problem; a CDN edge location having trouble in one region can make a site look down to some visitors while working fine for others, including whoever is investigating from their own location. An independent check from a neutral location rules this out quickly.
Partial downtime is also where it is easiest to underestimate severity. A broken checkout page on an otherwise-functional ecommerce site can be more costly than a fully down brochure site, since visitors are actively arriving and failing to complete a purchase rather than simply not visiting at all.
Communication During an Outage
For client-facing downtime, silence is worse than an honest update. A short message that says what is known, what is being done, and when the next update will come is enough. It does not need to explain root cause yet, and guessing at cause before you actually know it tends to create more confusion when the real cause turns out to be different.
Set a specific time for the next update, even if the honest answer is 'we do not have a fix yet.' A client who hears 'next update in 30 minutes' and then actually gets one in 30 minutes trusts the process, even during a bad outage, more than a client who gets a single message and then silence for two hours.
After the Site Comes Back Up
Recovery is not the same as resolution. A site that loads once after a restart may still be running on the same underlying condition that caused the outage, whether that is a memory leak, a database connection pool that will fill up again, or a DNS record that was only partially fixed. Schedule a follow-up check 15 to 30 minutes later, and another the next day, before considering the incident fully closed.
Note whatever caused the outage, even briefly, before moving on. A one-line record ('DNS record TTL was too long after a provider migration, causing a 40-minute propagation gap') is enough to make the next similar incident faster to diagnose, and to catch a genuine pattern if the same cause shows up again with a different client.
Common Mistakes
Jumping straight to restarting servers or rolling back a deploy before confirming what actually broke wastes time and can mask the real cause. Assuming the entire site is down when only one page or one region is affected leads to overreacting or investigating the wrong layer.
Not checking the hosting provider's status page early is a frequent time sink; teams sometimes spend an hour debugging their own application code during a provider-wide outage that was never theirs to fix. And declaring the incident over the moment the site loads once, without a follow-up check a few minutes later, misses situations where the fix only partially worked.
Skipping the diagnostic order and jumping straight to the most familiar layer (usually application code, since that is what most developers know best) instead of working outside-in from DNS often wastes the most time, especially when the actual cause turns out to be a DNS or hosting issue that would have been obvious with a quick check first.
How MonitorMojo Helps
An on-demand MonitorMojo check gives you an independent, outside read on reachability and response code the moment you suspect downtime, which is exactly the confirmation step this playbook starts with. Because checks run on demand rather than continuously, pair this with your own scheduled checks (via the API or CLI) so you find out about downtime from a script rather than a client email.
Check history lets you see exactly when a site went from reachable to unreachable, which narrows down whether a specific deploy or change lines up with the start of the outage. Once resolved, a follow-up check confirms the fix held rather than relying on a single successful reload.
What this workflow means
Website Downtime Response Plan is best understood as a repeatable website health workflow, not a promise that every outage or configuration issue will be avoided. A specific diagnostic order for confirming and resolving website downtime, from ruling out a local network issue through DNS, hosting, and application-layer causes.
In practice, this workflow centers on server response time, deployment changes, hosting constraints, caching behavior, and third-party dependencies. Each check is planning input: it can show that the site is reachable, that a certificate has a given expiry window, that response time has shifted, or that a header is missing. It cannot prove root cause by itself or replace a human response. The value is in making the review consistent enough that site owners and small teams can spot issues before someone downstream has to ask about them.
Who should use this
This is most useful for site owners and small teams. Developers who need a specific diagnostic order for downtime, not a general incident plan
Beyond that primary audience, the same checks are reusable by anyone with a public-facing URL that matters to revenue, leads, or reputation: a recurring review is cheap insurance compared to hearing about the problem from a client or customer first.
Step-by-step monitoring workflow
Start by listing the URLs that actually matter instead of just the homepage — for a small team doing a routine check before something breaks in front of a visitor, that usually means the pages tied to revenue, signups, or trust, not every page on the site.
Next, define the check types for each URL: reachability, HTTP status, HTTPS/SSL certificate status and expiry window, response time, redirect behavior, and security header presence. For API, CLI, and AI-agent workflows, document which endpoint or command runs the check and where the result is stored.
Set a cadence that matches the risk — a low-traffic page may only need a monthly look, while a page tied to revenue or signups deserves a check after every deployment and before any campaign or launch.
Record what you find with a consistent format: URL, check type, status, issue, owner, detected date, and next review date. Then say what actually happened in plain language — a check can surface a symptom, but site owners and small teams still need to confirm the cause.
- Choose the URLs that matter most to visitors, clients, revenue, and operations.
- Run uptime, SSL, response time, and security header checks on a consistent schedule.
- Triage failed or risky checks by likely owner: hosting, DNS, SSL, code, platform, or third party.
- Record notes in a repeatable format so future reviews do not start from scratch.
- Send a plain-language summary with the issue, impact, owner, and next review date.
- Run a confirmation check after remediation so there is an external result to reference.
Checklist or template
Use this template for recurring reviews: [URL], [Check Type], [Status], [Issue], [Priority], [Owner], [Detected Date], [Resolved Date], [Next Review Date]. Add a one-line summary at the top: what changed, what needs attention, and who owns the next step.
For site owners and small teams, group findings into the four signals that matter most: reachability, SSL status, response time, and security headers. Where nothing needs action, say the check found no issue in that area rather than implying full coverage.
- [URL]: the exact page or endpoint checked.
- [Check Type]: uptime, SSL, response time, headers, API, CLI, or agent workflow.
- [Status]: pass, review, failed, blocked, or needs human investigation.
- [Issue]: the observable symptom, not an unsupported root-cause claim.
- [Owner]: agency, developer, host, DNS provider, client, or third-party vendor.
- [Next Review Date]: when the team should confirm status again.
Common mistakes
The most common mistake is monitoring only the homepage while a checkout, signup, or booking flow silently breaks. Another is assuming SSL auto-renewal always works — it can fail quietly, and an external check is the only way to catch that before a browser warning does.
For site owners and small teams specifically, the recurring miss is treating one clean check as proof the whole site is fine, or fixing an issue without ever writing down what happened — which means the next person repeats the same investigation from zero.
- Tracking too many low-value URLs while missing the ones that matter.
- Skipping notes after an issue is resolved.
- Reporting a status without an owner or next step attached.
- Assuming automation can resolve an incident without human review.
- Treating one clean check as proof that every risk is covered.
Practical example
Consider a small team doing a routine check before something breaks in front of a visitor. A scheduled check flags that the site is slower than its usual baseline and that a security header is missing. Instead of guessing, the team logs the observation with a timestamp, assigns an owner, and re-checks after the fix ships — turning a vague "something feels off" into a specific, closed-loop task.
How MonitorMojo helps
MonitorMojo runs website health checks that combine reachability, SSL certificate status, response time, and security header presence in one workspace, so this workflow doesn't require stitching together several separate tools.
The API and CLI make the same checks scriptable for site owners and small teams who want them wired into an existing process, while credit-based checks keep it practical to run reviews exactly when they matter — before a client call, after a deploy, or when someone asks whether the site is healthy. Results still depend on hosting, DNS, and how quickly the responsible team acts on what the check finds.
Who this is for
- Developers who need a specific diagnostic order for downtime, not a general incident plan
- Agencies handling client outages under time pressure
- Small teams without dedicated infrastructure or SRE staff
- Anyone who has wasted time debugging the wrong layer during an outage
Frequently Asked Questions
How do I tell the difference between the site being down and my own network being the problem?
Check from a different network or device, or run an independent on-demand check. If it fails there too, the site itself is down.
What should I check first when a site goes down?
DNS resolution, then the hosting provider's status page, then recent deploys or configuration changes, then the application layer itself.
Does MonitorMojo alert me the moment a site goes down?
No. Checks run on demand. Schedule checks yourself through the API or CLI and route failures to your own notification channel for anything close to real-time coverage.
Can this playbook guarantee I avoid downtime entirely?
No. It shortens diagnosis and response time once downtime happens. It does not prevent hosting outages, bad deploys, or DNS misconfigurations from occurring.
How do I know the outage is really resolved and not just temporarily working?
Run a follow-up check a few minutes after the fix, not just once immediately after. A single successful load can be a fluke if the underlying cause (like a resource leak) is still present.
Can this prevent every issue with the site?
No. Monitoring helps site owners and small teams detect website health signals and organize follow-up, but it does not prevent every outage, SSL issue, slow response, or third-party failure. The result still depends on hosting, DNS, infrastructure, and how quickly the responsible team investigates and responds.